Category:Oceans

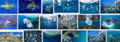
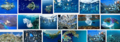
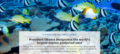
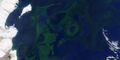
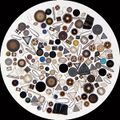
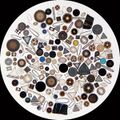
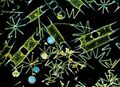
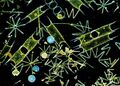
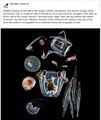
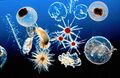
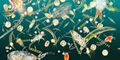
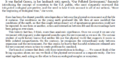
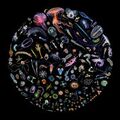
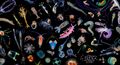
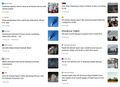
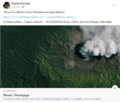
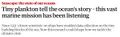
Ocean's hidden world of plankton revealed in 'enormous database' / May 2015 -- http://www.bbc.com/news/science-environment-32831814
__________________________________________________________________________________________________________________
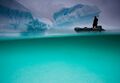
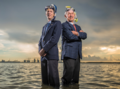
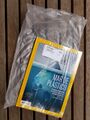
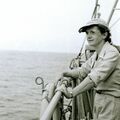
"Green" issues make headlines these days, but many seem unaware that without the "blue" there could be no green, no life on Earth and therefore none of the other things that humans value. Water--the blue--is the key to life."
-- Sylvia A. Earle, "The World Is Blue: How Our Fate and the the Ocean's Are One", National Geographic Publications, 2009
○ ○ ○ ○ ○ ○ ○ ○ ○ ○ ○ ○ ○ ○ ○ ○ ○ ○ ○ ○ ○ ○ ○ ○ ○ ○ ○ ○ ○ ○
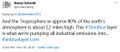
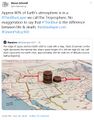
August 2015/NASA: "What's up with sea-level rise?"
Data from NASA coming i/o from JPL US/Euro mission control
http://www.nasa.gov/goddard/risingseas --- http://svs.gsfc.nasa.gov/cgi-bin/details.cgi?aid=11978 --- https://sealevel.jpl.nasa.gov/ --- http://www.washingtonpost.com/news/energy-environment/wp/2015/08/26/the-troubling-reasons-why-nasa-is-so-focused-on-studying-on-sea-level-rise/ --- https://en.wikipedia.org/wiki/Ocean_Surface_Topography_Mission
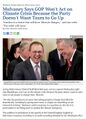
Why NASA’s so worried that Greenland’s melting could speed up
○ ○ ○ ○ ○ ○ ○ ○ ○ ○ ○ ○ ○ ○ ○ ○ ○ ○ ○ ○ ○ ○ ○ ○ ○ ○ ○ ○ ○ ○ ○ ○ ○ ○ ○ ○ ○
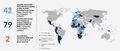
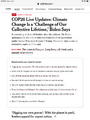
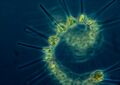
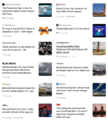
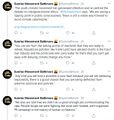
Global trends show seabird populations dropped 70 per cent since 1950s
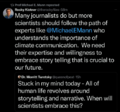
“Seabirds are particularly good indicators of the health of marine ecosystems,” said Paleczny. ”When we see this magnitude of seabird decline, we can see there is something wrong with marine ecosystems. It gives us an idea of the overall impact we’re having.”
The dramatic decline is caused by a variety of factors including overfishing of the fish seabirds rely on for food, birds getting tangled in fishing gear, plastic and oil pollution, introduction of non-native predators to seabird colonies, destruction and changes to seabird habitat, and environmental and ecological changes caused by climate change.
Seabirds tend to travel the world’s oceans foraging for food over their long lifetimes, and return to the same colonies to breed. Colony population numbers provide information to scientists about the health of the oceans the birds call home.
http://journals.plos.org/plosone/article?id=10.1371/journal.pone.0129342
_________________________________
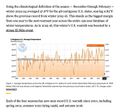
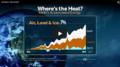
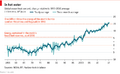
Where Is the Heat Going?
http://www.businessinsider.com/ocean-is-absorbing-heat-from-climate-change-2015-8
Here's where over 90% of the extra heat from global warming is going and the billions of dollars it's costing us
Via Business Insider / August 2015
http://www.businessinsider.com/future-marine-life-climate-change-2015-7
_____________________________________________________________________________________
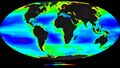
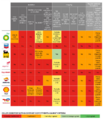
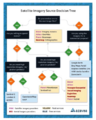
Contrasting futures for ocean and society from different anthropogenic CO2 emissions scenarios
via Science / July 2015
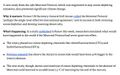
Although the ocean moderates anthropogenic climate change, this has great impacts on its fundamental physics and chemistry, with important consequences for ecosystems and people. Yet, despite the ocean’s critical role in regulating climate—and providing food security and livelihoods for millions of people—international climate negotiations have only minimally considered impacts on the ocean. Here, we evaluate changes to the ocean and its ecosystems, as well as to the goods and services they provide, under two contrasting CO2 scenarios: the current high-emissions trajectory (Representative Concentration Pathway 8.5, RCP8.5) and a stringent emissions scenario (RCP2.6) consistent with the Copenhagen Accord of keeping mean global temperature increase below 2°C in the 21st century. To do this, we draw on the consensus science in the latest assessment report of the Intergovernmental Panel on Climate Change and papers published since the assessment.
ADVANCES
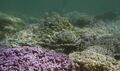
Warming and acidification of surface ocean waters will increase proportionately with cumulative CO2 emissions (see figure). Warm-water corals have already been affected, as have mid-latitude seagrass, high-latitude pteropods and krill, mid-latitude bivalves, and fin fishes. Even under the stringent emissions scenario (RCP2.6), warm-water corals and mid-latitude bivalves will be at high risk by 2100. Under our current rate of emissions, most marine organisms evaluated will have very high risk of impacts by 2100 and many by 2050. These results—derived from experiments, field observations, and modeling—are consistent with evidence from high-CO2 periods in the paleorecord.
Impacts to the ocean’s ecosystem services follow a parallel trajectory. Services such as coastal protection and capture fisheries are already affected by ocean warming and acidification. The risks of impacts to these services increase with continued emissions: They are predicted to remain moderate for the next 85 years for most services under stringent emission reductions, but the business-as-usual scenario (RCP8.5) would put all ecosystem services we considered at high or very high risk over the same time frame. These impacts will be cumulative or synergistic with other human impacts, such as overexploitation of living resources, habitat destruction, and pollution. Fin fisheries at low latitudes, which are a key source of protein and income for millions of people, will be at high risk.
OUTLOOK
Four key messages emerge. First, the ocean strongly influences the climate system and provides important services to humans. Second, impacts on key marine and coastal organisms, ecosystems, and services are already detectable, and several will face high risk of impacts well before 2100, even under the low-emissions scenario (RCP2.6). These impacts will occur across all latitudes, making this a global concern beyond the north/south divide. Third, immediate and substantial reduction of CO2 emissions is required to prevent the massive and mostly irreversible impacts on ocean ecosystems and their services that are projected with emissions greater than those in RCP2.6. Limiting emissions to this level is necessary to meet stated objectives of the United Nations Framework Convention on Climate Change; a substantially different ocean would result from any less-stringent emissions scenario. Fourth, as atmospheric CO2 increases, protection, adaptation, and repair options for the ocean become fewer and less effective.
The ocean provides compelling arguments for rapid reductions in CO2 emissions and eventually atmospheric CO2 drawdown...
○ ○ ○ ○ ○ ○ ○ ○ ○ ○ ○ ○ ○ ○ ○ ○ ○ ○ ○ ○ ○ ○ ○ ○ ○ ○ ○ ○ ○ ○ ○ ○ ○ ○ ○ ○ ○
July 9, 2015
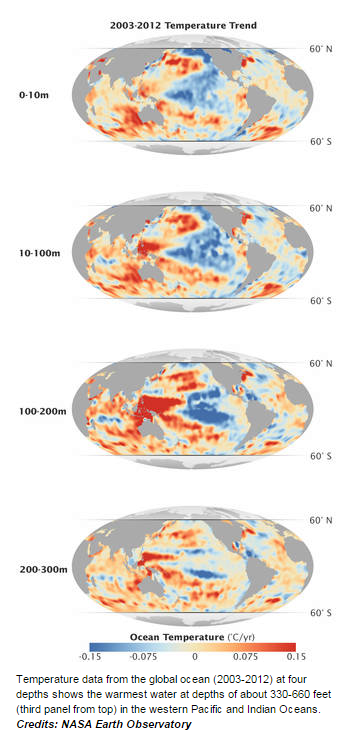
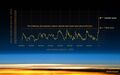
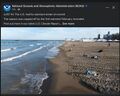
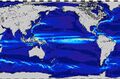
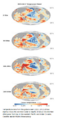
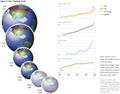
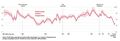
NASA Study Finds Indian, Pacific Oceans Temporarily Hide Global Warming
-- The new study used ocean temperature measurements from a global array of 3,500 Argo floats and other ocean sensors.
-- Temperature data from the global ocean (2003-2012) at four depths
-- Via NASA Earth Observatory http://www.nasa.gov/earth
A new NASA study of ocean temperature measurements shows in recent years extra heat from greenhouse gases has been trapped in the waters of the Pacific and Indian oceans. Researchers say this shifting pattern of ocean heat accounts for the slowdown in the global surface temperature trend observed during the past decade. Researchers Veronica Nieves, Josh Willis and Bill Patzert of NASA’s Jet Propulsion Laboratory (JPL), Pasadena, California, found a specific layer of the Indian and Pacific oceans between 300 and 1,000 feet (100 and 300 meters) below the surface has been accumulating more heat than previously recognized. They also found the movement of warm water has affected surface temperatures. The result was published Thursday in the journal Science.
During the 20th century, as greenhouse gas concentrations increased and trapped more heat energy on Earth, global surface temperatures also increased. However, in the 21st century, this pattern seemed to change temporarily.
"Greenhouse gases continued to trap extra heat, but for about 10 years starting in the early 2000s, global average surface temperature stopped climbing, and even cooled a bit," said Willis.
In the study, researchers analyzed direct ocean temperature measurements, including observations from a global network of about 3,500 ocean temperature probes known as the Argo array. These measurements show temperatures below the surface have been increasing.
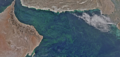
The Pacific Ocean is the primary source of the subsurface warm water found in the study, though some of that water now has been pushed to the Indian Ocean. Since 2003, unusually strong trade winds and other climatic features have been piling up warm water in the upper 1,000 feet of the western Pacific, pinning it against Asia and Australia.
"The western Pacific got so warm that some of the warm water is leaking into the Indian Ocean through the Indonesian archipelago," said Nieves, the lead author of the study.
The movement of the warm Pacific water westward pulled heat away from the surface waters of the central and eastern Pacific, which resulted in unusually cool surface temperatures during the last decade. Because the air temperature over the ocean is closely related to the ocean temperature, this provides a plausible explanation for the global cooling trend in surface temperature.
Cooler surface temperatures also are related to a long-lived climatic pattern called the Pacific Decadal Oscillation, which moves in a 20 to 30 year cycle. It has been in a cool phase during the entire time surface temperatures showed cooling, bringing cooler-than-normal water to the eastern Pacific and warmer water to the western side. There currently are signs the pattern may be changing to the opposite phase, with observations showing warmer-than-usual water in the eastern Pacific.
"Given the fact the Pacific Decadal Oscillation seems to be shifting to a warm phase, ocean heating in the Pacific will definitely drive a major surge in global surface warming," Nieves said.
Previous attempts to explain the global surface temperature cooling trend have relied more heavily on climate model results or a combination of modeling and observations, which may be better at simulating long-term impacts over many decades and centuries. This study relied on observations, which are better for showing shorter-term changes over 10 to 20 years. In shorter time spans, natural variations such as the recent slowdown in global surface temperature trends can have larger regional impacts on climate than human-caused warming.
Pauses of a decade or more in Earth's average surface temperature warming have happened before in modern times, with one occurring between the mid-1940s and late 1970s.
"In the long term, there is robust evidence of unabated global warming," Nieves said.
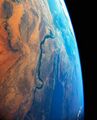
NASA uses the vantage point of space to increase our understanding of our home planet, improve lives and safeguard our future. NASA develops new ways to observe and study Earth's interconnected natural systems with long-term data records.
The agency freely shares this unique knowledge and works with institutions around the world to gain new insights into how our planet is changing.
______________________________________________________________________________________________________
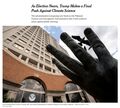
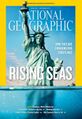
Sea-level Rise

○ ○ ○ ○ ○ ○ ○ ○ ○ ○ ○ ○ ○ ○ ○ ○ ○ ○ ○ ○ ○ ○ ○ ○ ○ ○ ○ ○ ○ ○ ○ ○
The ocean and the atmosphere exchange massive amounts of CO2
An anthropogenic flux has been superimposed on the natural flux
http://bit.ly/oceans_acidification
https://en.wikipedia.org/wiki/Ocean_acidification
○ ○ ○ ○
The Darkening Sea by Elizabeth Kolbert
http://www.newyorker.com/magazine/2006/11/20/the-darkening-sea
○ ○ ○ ○
Subcategories
This category has the following 18 subcategories, out of 18 total.
A
B
E
F
G
O
P
S
T
Pages in category "Oceans"
The following 90 pages are in this category, out of 90 total.
C
E
- Earth and Space, Politics
- Earth from NASA
- Earth Imaging-New Space
- Earth Right Now
- Earth Science
- Earth Science Research from Space
- Earth Science Vital Signs
- Ecolivia
- Environmental agreements
- Environmental Law, Rollbacks under Trump 2016-20
- Environmental Laws and Modern Environmental Movement
- Environmental movement
- Environmental protection
- ESA Living Planet Announcement - May 2022
- European Union Green Deal - Fit for 55
- Extinction
G
- George E. Brown Jr
- Glasgow Climate Summit - Pledges, Promises, Declarations - What's Next Up
- Global Fishing Watch
- Google Earth
- Google Earth Timelapse
- GP360 NewPages
- Green Politics 360
- Green Stories of the Day
- Green Stories of the Day - GreenPolicy360 Archive
- GreenPolicy360 Archive Highlights 2013
- GreenPolicy360 Archive Highlights 2014
- GreenPolicy360 Archive Highlights 2015
- GreenPolicy360 Archive Highlights 2016
- GreenPolicy360 Archive Highlights 2017
- GreenPolicy360 Archive Highlights 2018
- GreenPolicy360 Archive Highlights 2019
- GreenPolicy360 Archive Highlights 2020
- GreenPolicy360 Archive Highlights 2023
- GreenPolicy360 Highlights
L
P
S
T
V
Media in category "Oceans"
The following 200 files are in this category, out of 686 total.
(previous page) (next page) Monitoring Greenhouse Gases from Satellite Missions 2021-2030.png 801 × 386; 143 KB
 Montreal Protocol - effects study 2021.jpg 640 × 401; 76 KB
 Move along Florida-May 2018.png 448 × 454; 342 KB
 Moving to Higher Ground.png 568 × 473; 307 KB
 Multispectral Scanning Systen - MSS.jpg 688 × 587; 103 KB
 Mulvaney says no lifestyle change.jpg 561 × 779; 128 KB
 Mushroom life in the forest.png 640 × 458; 626 KB
 NASA co2-graph-061219.jpg 800 × 500; 214 KB
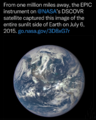 NASA EPIC DSCOVR - July 6 2015.png 768 × 956; 687 KB
 NASA Launch of Landsat 9 - Sept 27, 2021.jpg 675 × 772; 131 KB
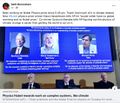
 NASA test mission to protect earth from asteroid - Nov 2021.png 508 × 800; 424 KB
 NASA's continuing vision and mission - as of 2005.png 640 × 414; 153 KB
 National Climate Pledges Must Be Enforced.png 800 × 520; 122 KB
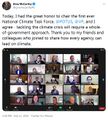 National Climate Task Force - first mtg Feb 11 2021.jpg 591 × 654; 144 KB
 NationalGeographic SouthPole melt West Antarctica 2016.jpg 630 × 438; 89 KB
 Navigate with Knowledge - StratDem - GreenPolicy360.jpg 800 × 534; 62 KB
 NDC Tracker - 2020.jpg 800 × 340; 50 KB
 New Economics Foundation logo.png 476 × 123; 9 KB
 New German government announces far reaching climate plans.png 632 × 600; 446 KB
 New Species Discovered-2018.png 800 × 212; 508 KB
 NextEra - January12 2021.jpg 530 × 127; 36 KB
 Nile River and Mideast.jpg 750 × 929; 87 KB
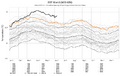
 NOAA - NCEI report on US temps 2023-2024.jpg 600 × 561; 109 KB
 NOAA Climate.Gov.png 589 × 99; 7 KB
 NOAA extreme weather events charting.png 663 × 600; 288 KB
 NOAA report on heat records broken in US - 2023.jpg 600 × 480; 229 KB
 NOAA undergoes political changes - Oct 2020.jpg 800 × 719; 135 KB
 Nobel Prize 2021.jpg 551 × 473; 212 KB
 Norilsk in the Russian Arctic.jpg 615 × 600; 134 KB
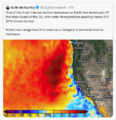 North America West Coast hot - Aug 2023.png 484 × 501; 308 KB
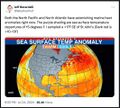 North Pacific and Atlantic sea temps - July 2024.jpg 532 × 480; 198 KB
 Not to worry 2016.png 539 × 401; 347 KB
 NYT - Nov 1 - Day 1 headlines from Glasgow Climate Summit.png 600 × 800; 103 KB
 Ocean - Protect Produce Prosper.jpg 700 × 81; 25 KB
 Ocean acidification NOAA s.jpg 359 × 211; 24 KB
 Ocean acidification Oxford.png 487 × 601; 285 KB
 Ocean currents from GOCE 20141125-jpg.jpg 670 × 440; 90 KB
 Ocean Friendly Restaurants - Surfrider Foundation.jpg 499 × 960; 110 KB
 Ocean Heat May 2015.png 714 × 400; 356 KB
 Ocean heat NOAA.png 800 × 493; 121 KB
 Ocean plant photosynthesis - measuring-monitoring via SeaWiFS.jpg 800 × 450; 90 KB
 Ocean Pollution w Plastic-800x280.png 800 × 280; 600 KB
 Ocean Pollution w Plastic.png 1,524 × 534; 1.62 MB
 Ocean temps 20013-2012 NASA.png 360 × 745; 247 KB
 Oceans and Climate Change - DeCaprio July 2022.png 600 × 689; 677 KB
 Oceans hottest in 2022.png 800 × 501; 358 KB
 Oceans losing oxygen-NASA.png 800 × 383; 799 KB
 OCO-2 carbon dioxide Sept2014-Sept2015.gif 530 × 353; 677 KB
 Oct 21, 2021 - On Eve of International Climate Summit.jpg 733 × 466; 119 KB
 Oil gas climate change response plans - circa 2022.png 729 × 837; 335 KB
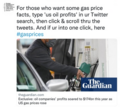 Oil profits and US gas prices.png 378 × 336; 163 KB
 On the Beach, In the Intertidal Zone.png 448 × 263; 175 KB
 On the heat beat... NYT reporting-June 21 2024.png 613 × 649; 147 KB
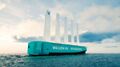 Orcelle-Wind design.jpg 640 × 356; 26 KB
 Our Biggest Experiment - by Alice Bell.jpg 333 × 499; 40 KB
 Our Fragile Moment.jpg 612 × 480; 80 KB
 Our Fragile Moment.png 301 × 448; 360 KB
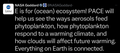 PACE - NASA Everything on Earth Is Connected.png 600 × 264; 70 KB
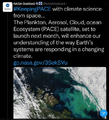 PACE - NASA Jan 17 2024.png 600 × 662; 465 KB
 Papahānaumokuākea sm.png 412 × 186; 230 KB
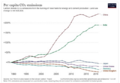 Per capita CO2 emissions - to 2020.png 640 × 442; 153 KB
 Philippe Cousteau at Bioneers Conf-2015.png 640 × 379; 452 KB
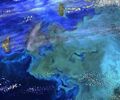
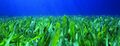
 Phyto glowing beauty of the oceans.jpg 480 × 265; 20 KB
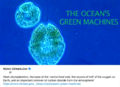 Phyto the Green Machine.png 640 × 465; 431 KB
 Phyto tinybluegreen.jpg 599 × 394; 58 KB
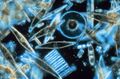
 Phytoplankton - the foundation of the oceanic food chain 560x396.jpg 560 × 396; 101 KB
 Phytoplankton - the foundation of the oceanic food chain m.jpg 720 × 508; 170 KB
 Phytoplankton - the foundation of the oceanic food chain.jpg 3,972 × 2,676; 5.44 MB
 Phytoplankton decline NASA study Sept2015.png 1,032 × 784; 522 KB
 Phytoplankton kamchatka NASA.jpg 720 × 360; 49 KB
 Phytoplankton m.jpg 300 × 300; 37 KB
 Phytoplankton-Phytopedia 2016.png 799 × 695; 732 KB
 Phytoplankton.jpg 600 × 600; 97 KB
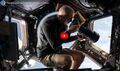 Picturing Earth from the International Space Station.jpg 800 × 470; 112 KB
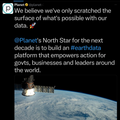 Planet and plan for an Earthdata platform.png 600 × 600; 280 KB
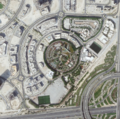 Planet Dove satellite image over Dubai.png 800 × 791; 1.58 MB
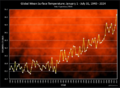 Planet Earth temperature taking - a recent history.png 800 × 584; 618 KB
 Planet home page-2022.png 800 × 400; 392 KB
 Planet Plan B - for Senator Manchin.jpg 640 × 361; 89 KB
 Plankton - phytoplankton m.jpg 773 × 558; 364 KB
 Plankton - phytoplankton.jpg 1,200 × 859; 955 KB
 Plankton Phytoplankton--'Climate Dance'.jpg 773 × 644; 161 KB
 Plankton story - New Yorker - Oct 2021.jpg 619 × 737; 125 KB
 Plankton swirl Jan 2015.jpg 720 × 480; 161 KB
 Plankton.jpg 400 × 259; 34 KB
 Planktonbluegreen tinyones.jpg 640 × 320; 99 KB
 Planting Corals Now.jpg 800 × 365; 72 KB
 Plastic packaging, plastic pollution.jpg 480 × 640; 55 KB
 Plastic Reduction agr plan.png 800 × 464; 672 KB
 Pope Francis - 2020.jpg 316 × 480; 12 KB
 Prochlorococcus blue-green.png 501 × 273; 86 KB
 Prochlorococcus blue-green.tiny ones.png 505 × 277; 130 KB
 Prochlorococcus featured at GreenPolicy360.png 497 × 642; 42 KB
 Production Gap - productiongap.org.png 600 × 762; 225 KB
 Production Gap - UN report on fossil fuel production.png 600 × 664; 342 KB
 Protect the Natural World.jpg 800 × 345; 78 KB
 Race to Zero - circa January 2022.png 480 × 591; 138 KB
 RacetoZero - Dec 2020 UNFCCC.jpg 585 × 518; 95 KB
 RACHEL CARSON - 1949.jpg 600 × 600; 102 KB
 Rachel Carson courtesy of Rachel Carson Estate.jpg 640 × 776; 264 KB
 Rachel Carson ecology - ecosystem.png 800 × 388; 0 bytes
 Rachel Carson Institute.png 800 × 522; 189 KB
 Rachel carson1 NYT-Illustration by Valero Doval.png 784 × 469; 0 bytes
 Rachel Lost Woods After Silent Spring m.png 800 × 196; 101 KB
 Racing Extinction websiteplankton 2.jpg 170 × 170; 10 KB
 Racing Extinction websiteplankton.jpg 664 × 360; 141 KB
 Rainfall-earthsciencefromspace.gif 530 × 299; 2.64 MB
 Rebecca Google Outreach.jpg 276 × 183; 9 KB
 Recent Satellite Imagery of Earth - via Azavea.png 600 × 747; 488 KB
 Record shattering heat - 5 nations 2019-2023.jpeg 577 × 640; 79 KB
 Record tumble - climate change.png 727 × 333; 27 KB
 Red List-IUCN.png 257 × 239; 13 KB
 RedList-2010.gif 463 × 365; 10 KB
 Rep. George E Brown and a young student remembering.png 640 × 325; 109 KB
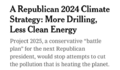 Republican Party 2024 Climate Strategy.png 589 × 344; 44 KB
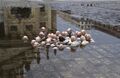 Rising seas Isaac Cordel.jpg 718 × 466; 78 KB
 Rising Seas NatGeo M Sept13.jpg 275 × 400; 37 KB
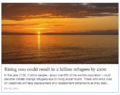 Rising Seas, refugees, Phys.org Land Use July 2017.png 488 × 385; 190 KB
 Russian satellite to monitor climate in the Arctic.jpg 638 × 281; 52 KB
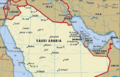 Saudi Arabia and Middle East - Hot in May 2024.png 640 × 410; 506 KB
 School strike for climate countries.png 800 × 411; 106 KB
 Science & Solutions - 2020 - Project Drawdown - NCSE Conf.jpg 800 × 351; 56 KB
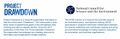 Science & Solutions - 2020 - Project Drawdown - NCSE.jpg 800 × 261; 66 KB
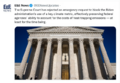
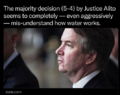 SCOTUS decision on water protection.png 535 × 424; 299 KB
 SCOTUS EPA decision - June 30 2022.jpg 794 × 778; 168 KB
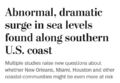 Sea levels surge along southern US coast.png 640 × 441; 69 KB
 Sea Wall of Miami +++.jpg 526 × 220; 48 KB
 Sea-Level Rise Twice as High as Previously Predicted.png 701 × 225; 92 KB
 Seagrass florida keys-noaa.jpg 700 × 267; 65 KB
 Sentinel-6 launched 11-21-2020.jpg 361 × 103; 12 KB
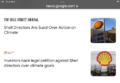 Shell lawsuit Feb 2023.png 768 × 534; 229 KB
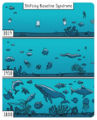 Shifting Baseline Syndrome - threats to ecosystems biodiversity.png 431 × 534; 322 KB
 Shifting Baselines 2.jpg 600 × 600; 140 KB
 Short Circuiting Policy - by Leah Stokes.jpg 595 × 423; 94 KB
 Shrinking earth.jpg 762 × 600; 167 KB
 Shrinking Shores Florida.png 750 × 336; 328 KB
 Shrinking the Earth, The Rise and Decline of Natural Abundance.jpg 180 × 274; 10 KB
 Sixth Mass Extinction infograph-NYT.jpg 1,626 × 2,220; 1.37 MB
 Sixth-extinction-global m.jpg 688 × 387; 167 KB
 Slash emission now or face climate disaster.jpg 800 × 579; 94 KB
 Small Is Beautiful 1973.jpg 257 × 388; 17 KB
 Solar panel price - 1976-2019.png 596 × 612; 92 KB
 South Florida Floodwaters.png 640 × 449; 251 KB
 SouthFloridaSLR 2s-.gif 800 × 471; 349 KB
 Space stations - July 26 2022.png 544 × 462; 270 KB
 Space-Quarterly-Earth Observations NanoRacks.png 671 × 812; 956 KB
 Space-Quarterly-NanoRacks Dec 2012.pdf ; 2.18 MB
 St Francis at the São Paulo Zoo 2018 - wiki commons.jpg 800 × 533; 70 KB
 St Francis with the birds.jpg 305 × 394; 27 KB
 St.FrancisPreachingtotheBirds Giotto.jpg 213 × 213; 49 KB
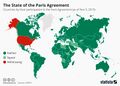 State of the paris agreement nov2019.jpg 800 × 570; 178 KB
 Story telling and science education.png 515 × 480; 171 KB
 StratDem Strategic Demands.png 768 × 1,024; 626 KB
 Strike - Sept 20.jpg 754 × 754; 44 KB
 SunriseBmore March 1, 2021.jpg 593 × 622; 187 KB
 Supreme Court decision on GHG emission cost metric - May 2022.png 640 × 442; 419 KB
 Sylvia Earle.jpg 250 × 165; 12 KB
 Tara Expedition.png 700 × 437; 697 KB
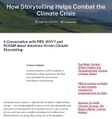 Telling stories of solutions for the climate crisis.jpg 600 × 640; 121 KB
 Temperature - SST World via Climate Change Institute - 2023 chart.png 800 × 509; 144 KB
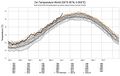 Temperature World - chart via Climate Change Institute.jpg 800 × 509; 67 KB
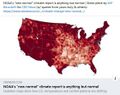 Temperatures New Normal is Not Normal.jpg 582 × 461; 56 KB
 The Carbon Dioxide Theory of Climatic Change, by Gilbert Plass, 1956.jpg 798 × 1,202; 397 KB
 The Climate Dictionary - as of 2023.png 600 × 727; 200 KB
 The New Climate War - Irish Times review 2021.jpg 792 × 2,048; 373 KB
 The Ocean Cleanup May2015.jpg 1,000 × 563; 39 KB
 The Original Mission Statement of NASA.png 787 × 166; 14 KB
 The Story of Bottled Water video.png 702 × 395; 97 KB
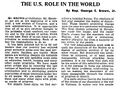 The U.S. Role in the World ... Congressman George E Brown - 1969.jpg 448 × 334; 104 KB
 The World Is Blue.jpg 340 × 499; 40 KB
 Thereisnoplanetb.com .jpg 940 × 198; 48 KB
 They Knew.jpg 287 × 428; 31 KB
 Thin Blue difference - approx 12 miles high.jpg 527 × 229; 37 KB
 Thin Blue difference.jpg 527 × 673; 147 KB
 Thin Blue Earth Atmosphere - @AstroSamantha.jpg 680 × 453; 14 KB
 Threat Environment - TBay Times Series on Climate Change Impacts.png 556 × 864; 166 KB
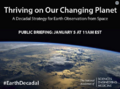 Thriving on Our Changing Planet.png 495 × 369; 244 KB
 Time for a Planet Update - Oct 31 2021.png 722 × 600; 852 KB
 Time Nov 10 2022 COP27.jpg 600 × 600; 92 KB
 Timelapse in Google Earth -1.jpg 800 × 241; 69 KB
 Timelapse in Google Earth-2.jpg 800 × 469; 151 KB
 Timelapse in Google Earth-3.jpg 372 × 556; 52 KB
 Timelapse in Google Earth-4.jpg 525 × 244; 51 KB
 Timelapse in Google Earth-5.jpg 800 × 528; 124 KB
 Timelapse.png 800 × 566; 676 KB
 Timeline-climate-change-history-485-million years.jpg 800 × 276; 42 KB
 Tiny Plankton - via The Guardian.jpg 591 × 181; 59 KB


