Citizen Science
GreenPolicy360 Says Be a Planet Citizen and Do Citizen Science
- Citizen Science
···························································
InMap, Intervention Model for Air Pollution
- https://inmap.run/
- https://eos.org/research-spotlights/the-global-health-benefits-of-going-net-zero
- https://agupubs.onlinelibrary.wiley.com/doi/full/10.1029/2022GH000713
Low-cost sensors are helping communities find gaps in air quality data
A wave of community air monitoring efforts taking off around the US
The citizen-run sensors picked up high levels of benzene, toluene, and fine particulate matter, contaminants linked to elevated risks of cancer and heart disease
·············································································································································
Identify your birds using their songs, chirps and peeps
Set up a Haikubox
Stunning images -“Yes, that’s the bird I’ve seen!”
Recording and spectrogram of each bird visit - “Last night’s birds sounded so beautiful!”
Daily counts plus hourly breakdowns - “The owls were active at 2am!”
Share your bird recordings via social media or web link - “You must hear this bird!”
Set up alerts - “I have a migrating bird visiting!”
List of your top 10 - “I host lots of Song Sparrows!
LISTEN
Once connected to your WiFi, Haikubox will listen for birds 24/7. When BirdNet for Haikubox finds a match with its thousands of labeled sounds, it identifies the bird species and shares an audio clip to the Haikubox website and smartphone app.
LEARN
You can see identified bird images, listen to and view spectrograms of recorded birdsong, receive notifications when a species is detected, and check charts showing how often and when each species visits your yard. Users also can learn about each bird’s range and unique behavior via links to the Cornell Lab of Ornithology websites.
🌎
New effort to save birds pinpoints in amazing detail where they fly
by Anders Gyllenhaal / Excerpt via the Washington Post and wire services
For years, as California's Central Valley grew into the nation's leading agricultural corridor, the region gradually lost almost all of the wetlands that birds, from the tiny sandpiper to the great blue heron, depend on during their migrations along the West Coast.
But a dramatic turnaround is underway in the valley. Dozens of farmers leave water on their fields for a few extra weeks each season to create rest stops for birds. The campaign has not only helped salvage a vital stretch of the north-south migration path called the Pacific Flyway but also tested a fresh model for protecting wildlife.
The experiment is built on new research by the Cornell Lab of Ornithology, which blends the sightings of tens of thousands of birdwatchers with satellite photos and wildlife data. The combination produces digital maps so precise that they can predict when and where birds will come through, so that farmers know when to flood their fields.
"The amount of information in these maps is way beyond what any single source or even combination of sources could give you, said Marshall Iliff, project co-leader of Cornell's eBird Project. "It's on a scale that's never been done before.
At a time when 40% of the Earth's 10,000 bird species are in decline, according to the State of the World's Birds 2018 report, the still-developing eBird Project helps to remake traditional conservation.
More than 400,000 birders have sent in 34 million lists of species in the United States and dozens of other countries in recent years. That makes this the largest citizen-science effort to date. Birders have reported seeing almost every species on Earth.
As the data have poured in, the research started to reveal important, concrete findings about how birds are adjusting to changing climates.
They show how species such as the American bald eagle, a major conservation success story, can be found in every state as its numbers and habitat expand. They show how other birds, such as some hummingbirds and warblers, struggle to adapt to warming trends, which are trimming breeding seasons and reducing their numbers.
Last fall, Cornell launched the stunning animated maps, which bring the migration to life by converting somewhat dry data into video illustrations that show routes birds take over the course of a year.
Re: 'Global Big Day' / May 4, 2019
- • https://cornellsun.com/2019/04/29/global-big-day-24-hour-extreme-birding-event-to-take-place-may-4/
🌎
Go Zooniverse, Go!
Million+ registered users doing Citizen Science
People-powered research, science counts
🌎
Clean Air Apps, Citizen Science in Action
Citizen Crowdsourcing, Citizen Networking, Citizen Science in Action
Continuing GreenPolicy360's global AQI program
Citizens using the Internet to measure and monitor the impact of pollution and access to the information needed to protect public health.
This is crucial information to know -- and to use. According to Plume Labs, only 0.246% of the earth has access to this vital information.
🌎
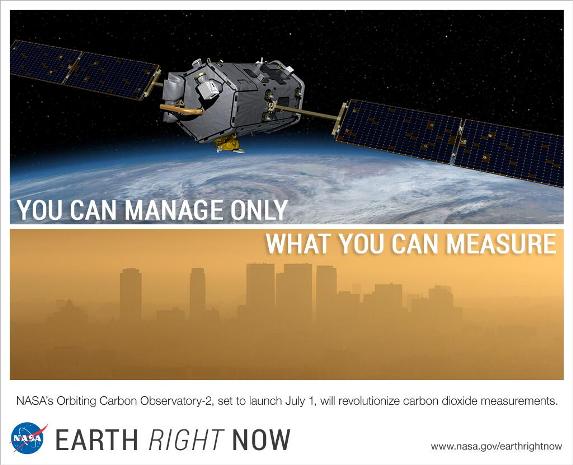
Our GreenPolicy360 Message: Measure-to-Manage
Planet Citizens in Action
○ ○ ○ ○ ○ ○ ○ ○ ○ ○ ○ ○ ○ ○
○ ○ ○ ○ ○ ○ ○ ○ ○ ○ ○ ○ ○ ○
○ ○ ○ ○ ○ ○ ○ ○ ○ ○ ○ ○ ○ ○
Healthy Lungs Are Good
Atmotube: Portable Air Pollution Monitor
Wearable prototype app to track carbon footprints
○
Aclima air pollution sensors mounted on cars
Google Green Blog -- Make the Invisible Visible by Mapping Air Quality
Aclima-Google-City air quality mapping
"The partnership enables a paradigm-shift in environmental awareness by equipping Street View cars with Aclima’s mobile sensing platform to see the air around us in ways never before possible. Three Street View cars took measurements of nitrogen dioxide, nitric oxide, ozone, carbon monoxide, carbon dioxide, methane, black carbon, particulate matter, and Volatile Organic Compounds (VOCs) -- air pollutants which can affect human health or climate change." (from the press release announcement)
Our GreenPolicy360 proposals from 2014/15 have come to be !
Here we are in December 2018 !!
Do You Know What You’re Breathing?
Acting to measure the air pollution around you. Acting to make a difference in the air you and your family breathe.
As climate change reports become increasingly dire, and as wildfires tear across the American West, and as trust in the federal government’s air quality oversight fades, thousands of people around the country are taking air measurements into their own hands.
Installed on a porch, a console table or hooked to a backpack, these small, sleek and increasingly inexpensive devices measure hyper-local air quality. They are marketed to the discerning and alarmed consumer. Some have begun to self-identify as “breathers.”
The Atmotube and PlumeLab’s Flow are small and meant to be carried around, testing the air as a person walks or bikes, helping people plan routes that avoid bad air. The Awair looks like an old-timey radio and sits on a counter to test indoor air. Aeroqual’s particulate monitor, one of the most advanced, looks like an enormous old-fashioned cellphone.
But the monitor most intriguing local government environmental protection agencies and civilians alike is PurpleAir. It hooks up outside, connects to Wi-Fi, feeds into a global network and creates something like a guerrilla air quality monitoring network....
○
Citizen Crowdsourcing, Citizen Networking, Citizen Science in Action
http://blog.epa.gov/science/2015/03/training-citizen-scientists-to-monitor-air-quality/
https://twitter.com/epablog -- http://blog.epa.gov/science/
-=-=-=-=-=-=-=-=-=-=-=-=-=-=-=-=-=-=-=-=-=-=-=-=-=-=-=-=-=-=-=-=-=-=-=-=-=-
- Wearable Devices / 'Digibody'
With Wearable Devices That Monitor Air Quality, Scientists Can Crowdsource Pollution Maps
Emerging technology means anyone with a smartphone can become a mobile environmental monitoring station
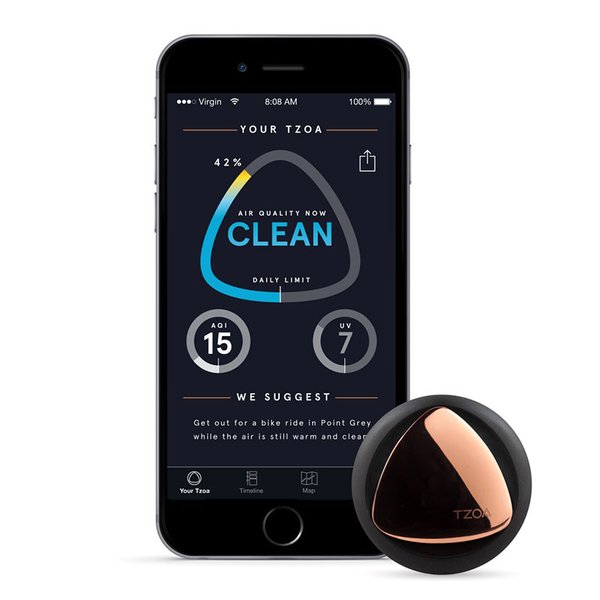
http://www.mytzoa.com/#homepage
-=-=-=-=-=-=-=-=-=-=-=-=-=-=-=-=-=-=-=-=-
https://www.kickstarter.com/projects/741031201/airbeam-share-and-improve-your-air
http://pubs.acs.org/stoken/presspac/presspac/abs/10.1021/es505362x
-=-=-=-=-=-=-=-=-=-=-=-=-
Air Visibility Monitoring (Android app) - http://robotics.usc.edu/~mobilesensing/Projects/AirVisibilityMonitoring
Biodiversity Group - http://www.biodiversitygroup.org/
Citizen Science Alliance - http://www.citizensciencealliance.org/
Climate Change and Citizen Science - http://www.slideshare.net/CitizenScienceCentral/citizen-science-and-climate-change-west
Cyber Citizens - http://up.secondwavemedia.com/innovationnews/smartphone100913.aspx
Dark Sky Meter (iOS app) - http://www.darkskymeter.com/home-2/
Eight Apps that Turn Citizens into Scientists - http://www.scientificamerican.com/article/8-apps-that-turn-citizens-into-scientists/
Globe at Night (light pollution) - http://www.globeatnight.org/
Great Sunflower Project / Bees - http://www.greatsunflower.org/
iCoast (USGS) - http://coastal.er.usgs.gov/icoast/about.php
iSpot Nature (Open Lab/Open Univ) - http://www.ispotnature.org/communities/global
International Barcode of Life - http://ibol.org/
LeafSnap (Smithsonian) - http://leafsnap.com/
Loss of the Night (Light Pollution) - http://cosalux.de/#/en/portfolio-en/loss-of-the-night-android-app/
Marine Animal Identification Network (online template) - http://main.whoi.edu/report.cfm
Marine Debris Tracker - http://www.marinedebris.engr.uga.edu/
Mobile Apps for Citizen Science (via Smithsonian) - http://www.ssec.si.edu/blog/mobile-apps-for-citizen-science
NASA Earth Exchange (NEX platform for scientific collaboration, knowledge sharing and research for the Earth science community) - https://nex.nasa.gov/nex/
National Science Foundation (US/"Citizen Science") - http://www.nsf.gov/news/special_reports/science_nation/citizenscience.jsp
NestWatch - http://nestwatch.org/
NOAA - http://www.climate.gov/teaching/resources/climate-change-and-citizen-science
Nova Energy Lab (PBS-Harvard) - http://www.pbs.org/wgbh/nova/labs/lab/energy/
Ocean Spaces (monitoring marine protected areas) - http://oceanspaces.org/
Open Scientist - http://www.openscientist.org/p/citizen-science-for-your-phone.html
Open Tree (urban forest mapping) - https://www.opentreemap.org/
Open University Lab - http://www.open.ac.uk/researchprojects/open-science/
Project Noah (National Geographic) - http://www.projectnoah.org/
SatCam (iOS app) supports the Terra, Aqua, and Suomi NPP satellites - http://satcam.ssec.wisc.edu/
SciStarter (list of several hundred cit science projects) - http://scistarter.com/index.html / http://scistarter.com/blog/#sthash.ex9FXlZ3.dpbs
Scientific American - http://www.scientificamerican.com/citizen-science/
Sensr, Citizen Science app (Carnegie Mellon) - http://www.sensr.org/
TreeMap LA (TreePeople) - http://www.treepeople.org/ - https://www.treepeople.org/action
Union of Concerned Scientists, You + Your Computer = Carbon Detective - http://www.ucsusa.org/global_warming/what_you_can_do/climate-change-citizen-science.html#.VLgLJHv44Rk
US Global Change/Climate Assessment (Dec 2014) - http://www.globalchange.gov/news/open-government-data-more-resilient-natural-resources
- http://www.whitehouse.gov/blog/2014/12/09/unleashing-climate-data-and-innovation-more-resilient-ecosystems
- http://www.whitehouse.gov/sites/default/files/microsites/ostp/cdi-ecosystems-12-9.pdf
Water monitoring (http://www.wef.org/ education/kit) - https://www.lamotte.com/secure/wwmday/
Whale Song Project - http://whale.fm/
You can be a scientist too (EPA) - http://www.epa.gov/climatestudents/scientists/citizen-science.html
Zooniverse - https://www.zooniverse.org/
-=-=-=-=-=-=-=-=-=-=-=-=-=-=-=-=-=-=-=-=-=-=-
Healthy Earth Lungs Are Good
The Breathing Earth | Climate Change Data Visualization
-=-=-=-=-=-=-=-=-=-=-=-=-=-=-=-=-=-=-=-=-=-=-=-=-=-=-=-=-=-=-=-=-=-
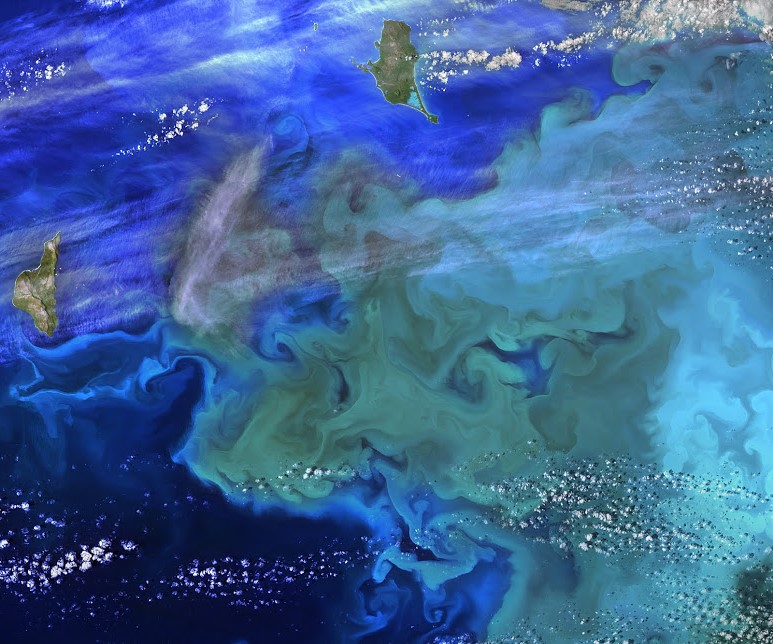
Blue-Green in the Oceans & Connection to Breathing on Earth
Fact: 71% of the planet is covered by ocean
- "A single kind of blue-green algae in the ocean produces the oxygen in one of every five breaths we take"
- ~ from "The World Is Blue: How Our Fate and the Ocean’s Are One" by Sylvia Earle / National Geographic
- "A single kind of blue-green algae in the ocean produces the oxygen in one of every five breaths we take"
○ ○ ○ ○ ○ ○ ○ ○ ○ ○ ○ ○ ○ ○ ○ ○ ○ ○
"The Tiny Little Ones - Plankton"
- "Ecosystems of the Sea"
- Nearly all marine plants are single celled, photosynthetic plankton-algae...
- It is estimated that marine plants produce well over 50% percent of the oxygen in the atmosphere...
GLOBAL PLANKTON WATCH SECCHI DISK
THE GLOBAL SEAFARER STUDY OF THE MARINE PHYTOPLANKTON
ABOUT THE PROJECT
The phytoplankton in the sea account for approximately 50% of all photosynthesis on Earth and, through the food web they support, they underpin the marine food chain.
Living at the surface of the sea the phytoplankton are particularly sensitive to changes in sea surface temperature.
We need to know much more about these changes and you can help by making a simple piece of scientific equipment called a Secchi Disk and using the free Secchi App.
Full instructions for the project are included in the free Secchi App.
Press Release -- Scientists fear the population of the microscopic beings is in decline due to rising sea temperatures and, if true, that could have consequences for every aspect of marine life.
Plankton biologist Dr Richard Kirby, who is leading the study, said: "As the phytoplankton live at the surface of the sea they are being affected by rising sea temperatures due to climate change. A scientific paper published in 2010 suggested the ocean's plankton population had declined by as much as 40 per cent since 1950. Like all marine creatures, phytoplankton have a preferred optimum sea temperature no matter where they are in the world and we need to know more about how they are changing in order to understand the effects on the ocean's biology.” To check the levels of phytoplankton in our oceans, marine experts have developed a free smart phone app for sailors and fishermen to use wherever they are in the world.
Dr Kirby added: "The Secchi Disks are still used by marine scientists to study phytoplankton but there are too few scientists to survey the world's oceans as well as we would wish. This app enables seafarers around the world to take part in a science project and if we can just get a small percentage of the global population of sailors involved, we can generate a database that will help us understand how life in the oceans is changing. It would help us learn much more about these important organisms at a crucial time when their habitat is altering due to climate change."
The Secchi app has been developed by Dr Nicholas Outram and Dr Nigel Barlow, from Plymouth University’s School of Computing and Mathematics, and the database will be maintained by Pixalytics Ltd.
○
Phytoplankton obtain energy through the process of photosynthesis and must therefore live in the well-lit surface layer (termed the euphotic zone) of an ocean, sea, lake, or other body of water. Phytoplankton account for half of all photosynthetic activity on Earth. Thus phytoplankton are responsible for much of the oxygen present in the Earth’s atmosphere – half of the total amount produced by all plant life. http://en.wikipedia.org/wiki/Phytoplankton
○
Marine Biodiversity Strongly Linked to Ocean Temperature
ScienceDaily (July 29, 2010) — In an unprecedented effort that will be published online on the 28th of July by the international journal Nature, a team of scientists mapped and analyzed global biodiversity patterns for over 11,000 marine species ranging from tiny zooplankton to sharks and whales. The researchers found striking similarities among the distribution patterns, with temperature strongly linked to biodiversity for all thirteen groups studied. These results imply that future changes in ocean temperature, such as those due to climate change, may greatly affect the distribution of life in the sea.
http://www.sciencedaily.com/releases/2010/07/100728131707.htm
http://www.scientificamerican.com/article/8-apps-that-turn-citizens-into-scientists/?page=2
http://www.bbc.com/news/science-environment-26483166
http://blog.education.nationalgeographic.com/2014/03/11/help-map-ocean-plankton/
Video - https://youtu.be/6z1Mjgb8Mqs
-=-=-=-=-=-=-=-=-=-=-=-=-=-=-=-=-=-=-=-=-=-=-=-=-=-=-=-=-=-=-=-=-=-=-=-=-=-
Eyes in the Sky: Green Groups Are Harnessing Data from Space
Earth Science, Planetary Awareness
/ #CitizenScience / #PlanetCitizen / #PlanetCitizens
- Additional Website Resources - Linked Data - Green Best Practices
- Air Pollution
- Air Quality
- Atmospheric Science
- Biodiversity
- Biosphere
- Citizen Science
- Climate Change
- Climate Policy
- Democratization of Space
- Democracy
- Digital Citizen
- Earth Law
- Earth Observations
- Earth Science
- Earth360
- EarthPOV
- Eco-nomics
- Ecology Studies
- Ecoregions
- Education
- Environmental Full-cost Accounting
- Environmental Security
- Environmental Security, National Security
- EOS eco Operating System
- Externalities
- Global Security
- Land Ethic
- Maps
- Natural Resources
- Nature
- New Space
- Oceans
- Ocean Ecosystem
- Ocean Science
- Ocean Sustainability
- Online Education
- Planet API
- Planet Citizen
- Planet Citizens
- Planet Scientist
- Planet Citizens, Planet Scientists
- Pollution
- Sea-Level Rise & Mitigation
- Sustainability
- Sustainability Policies
- ThinBlueLayer
- Virtual Planet
- Whole Earth
- World Wide Web
- Youth


