Category:Oceans

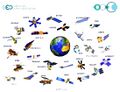
Ocean's hidden world of plankton revealed in 'enormous database' / May 2015 -- http://www.bbc.com/news/science-environment-32831814
____________________________________________________________________________________________________________________
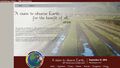
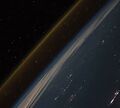
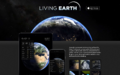
"Green" issues make headlines these days, but many seem unaware that without the "blue" there could be no green, no life on Earth and therefore none of the other things that humans value. Water--the blue--is the key to life."
-- Sylvia A. Earle, "The World Is Blue: How Our Fate and the the Ocean's Are One", National Geographic Publications, 2009
○ ○ ○ ○ ○ ○ ○ ○ ○ ○ ○ ○ ○ ○ ○ ○ ○ ○ ○ ○ ○ ○ ○ ○ ○ ○ ○ ○ ○ ○ ○ ○ ○ ○ ○ ○ ○
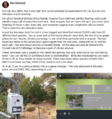
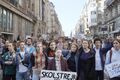
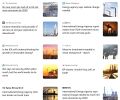
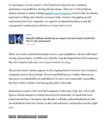
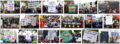
Global trends show seabird populations dropped 70 per cent since 1950s
“Seabirds are particularly good indicators of the health of marine ecosystems,” said Paleczny. ”When we see this magnitude of seabird decline, we can see there is something wrong with marine ecosystems. It gives us an idea of the overall impact we’re having.”
The dramatic decline is caused by a variety of factors including overfishing of the fish seabirds rely on for food, birds getting tangled in fishing gear, plastic and oil pollution, introduction of non-native predators to seabird colonies, destruction and changes to seabird habitat, and environmental and ecological changes caused by climate change.
Seabirds tend to travel the world’s oceans foraging for food over their long lifetimes, and return to the same colonies to breed. Colony population numbers provide information to scientists about the health of the oceans the birds call home.
http://journals.plos.org/plosone/article?id=10.1371/journal.pone.0129342
_________________________________
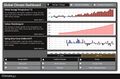
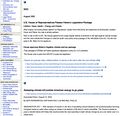
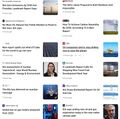
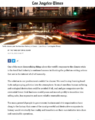
Where Is the Heat Going?
http://www.businessinsider.com/ocean-is-absorbing-heat-from-climate-change-2015-8
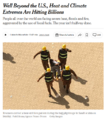
Here's where over 90% of the extra heat from global warming is going and the billions of dollars it's costing us
Via Business Insider / August 2015
http://www.businessinsider.com/future-marine-life-climate-change-2015-7
_____________________________________________________________________________________
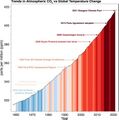
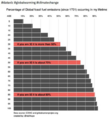
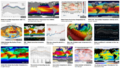
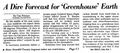
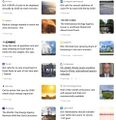
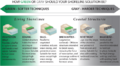
Contrasting futures for ocean and society from different anthropogenic CO2 emissions scenarios
via Science / July 2015
Although the ocean moderates anthropogenic climate change, this has great impacts on its fundamental physics and chemistry, with important consequences for ecosystems and people. Yet, despite the ocean’s critical role in regulating climate—and providing food security and livelihoods for millions of people—international climate negotiations have only minimally considered impacts on the ocean. Here, we evaluate changes to the ocean and its ecosystems, as well as to the goods and services they provide, under two contrasting CO2 scenarios: the current high-emissions trajectory (Representative Concentration Pathway 8.5, RCP8.5) and a stringent emissions scenario (RCP2.6) consistent with the Copenhagen Accord of keeping mean global temperature increase below 2°C in the 21st century. To do this, we draw on the consensus science in the latest assessment report of the Intergovernmental Panel on Climate Change and papers published since the assessment.
ADVANCES
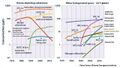
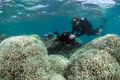
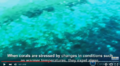
Warming and acidification of surface ocean waters will increase proportionately with cumulative CO2 emissions (see figure). Warm-water corals have already been affected, as have mid-latitude seagrass, high-latitude pteropods and krill, mid-latitude bivalves, and fin fishes. Even under the stringent emissions scenario (RCP2.6), warm-water corals and mid-latitude bivalves will be at high risk by 2100. Under our current rate of emissions, most marine organisms evaluated will have very high risk of impacts by 2100 and many by 2050. These results—derived from experiments, field observations, and modeling—are consistent with evidence from high-CO2 periods in the paleorecord.
Impacts to the ocean’s ecosystem services follow a parallel trajectory. Services such as coastal protection and capture fisheries are already affected by ocean warming and acidification. The risks of impacts to these services increase with continued emissions: They are predicted to remain moderate for the next 85 years for most services under stringent emission reductions, but the business-as-usual scenario (RCP8.5) would put all ecosystem services we considered at high or very high risk over the same time frame. These impacts will be cumulative or synergistic with other human impacts, such as overexploitation of living resources, habitat destruction, and pollution. Fin fisheries at low latitudes, which are a key source of protein and income for millions of people, will be at high risk.
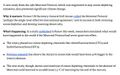
OUTLOOK
Four key messages emerge. First, the ocean strongly influences the climate system and provides important services to humans. Second, impacts on key marine and coastal organisms, ecosystems, and services are already detectable, and several will face high risk of impacts well before 2100, even under the low-emissions scenario (RCP2.6). These impacts will occur across all latitudes, making this a global concern beyond the north/south divide. Third, immediate and substantial reduction of CO2 emissions is required to prevent the massive and mostly irreversible impacts on ocean ecosystems and their services that are projected with emissions greater than those in RCP2.6. Limiting emissions to this level is necessary to meet stated objectives of the United Nations Framework Convention on Climate Change; a substantially different ocean would result from any less-stringent emissions scenario. Fourth, as atmospheric CO2 increases, protection, adaptation, and repair options for the ocean become fewer and less effective.
The ocean provides compelling arguments for rapid reductions in CO2 emissions and eventually atmospheric CO2 drawdown...
○ ○ ○ ○ ○ ○ ○ ○ ○ ○ ○ ○ ○ ○ ○ ○ ○ ○ ○ ○ ○ ○ ○ ○ ○ ○ ○ ○ ○ ○ ○ ○ ○ ○ ○ ○ ○
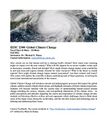
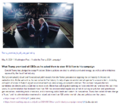
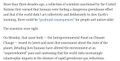
July 9, 2015
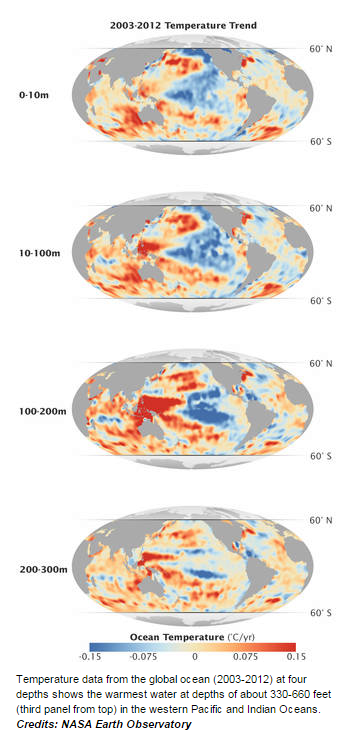
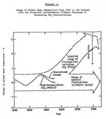
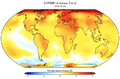
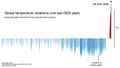
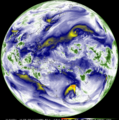
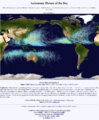
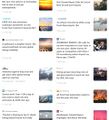
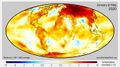
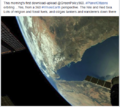
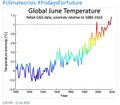
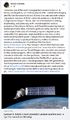
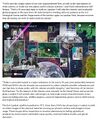
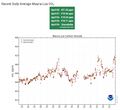
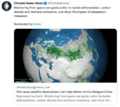
NASA Study Finds Indian, Pacific Oceans Temporarily Hide Global Warming
-- The new study used ocean temperature measurements from a global array of 3,500 Argo floats and other ocean sensors.
-- Temperature data from the global ocean (2003-2012) at four depths
-- Via NASA Earth Observatory http://www.nasa.gov/earth
A new NASA study of ocean temperature measurements shows in recent years extra heat from greenhouse gases has been trapped in the waters of the Pacific and Indian oceans. Researchers say this shifting pattern of ocean heat accounts for the slowdown in the global surface temperature trend observed during the past decade. Researchers Veronica Nieves, Josh Willis and Bill Patzert of NASA’s Jet Propulsion Laboratory (JPL), Pasadena, California, found a specific layer of the Indian and Pacific oceans between 300 and 1,000 feet (100 and 300 meters) below the surface has been accumulating more heat than previously recognized. They also found the movement of warm water has affected surface temperatures. The result was published Thursday in the journal Science.
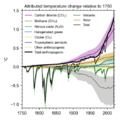
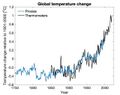
During the 20th century, as greenhouse gas concentrations increased and trapped more heat energy on Earth, global surface temperatures also increased. However, in the 21st century, this pattern seemed to change temporarily.
"Greenhouse gases continued to trap extra heat, but for about 10 years starting in the early 2000s, global average surface temperature stopped climbing, and even cooled a bit," said Willis.
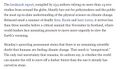
In the study, researchers analyzed direct ocean temperature measurements, including observations from a global network of about 3,500 ocean temperature probes known as the Argo array. These measurements show temperatures below the surface have been increasing.
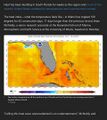
The Pacific Ocean is the primary source of the subsurface warm water found in the study, though some of that water now has been pushed to the Indian Ocean. Since 2003, unusually strong trade winds and other climatic features have been piling up warm water in the upper 1,000 feet of the western Pacific, pinning it against Asia and Australia.
"The western Pacific got so warm that some of the warm water is leaking into the Indian Ocean through the Indonesian archipelago," said Nieves, the lead author of the study.
The movement of the warm Pacific water westward pulled heat away from the surface waters of the central and eastern Pacific, which resulted in unusually cool surface temperatures during the last decade. Because the air temperature over the ocean is closely related to the ocean temperature, this provides a plausible explanation for the global cooling trend in surface temperature.
Cooler surface temperatures also are related to a long-lived climatic pattern called the Pacific Decadal Oscillation, which moves in a 20 to 30 year cycle. It has been in a cool phase during the entire time surface temperatures showed cooling, bringing cooler-than-normal water to the eastern Pacific and warmer water to the western side. There currently are signs the pattern may be changing to the opposite phase, with observations showing warmer-than-usual water in the eastern Pacific.
"Given the fact the Pacific Decadal Oscillation seems to be shifting to a warm phase, ocean heating in the Pacific will definitely drive a major surge in global surface warming," Nieves said.
Previous attempts to explain the global surface temperature cooling trend have relied more heavily on climate model results or a combination of modeling and observations, which may be better at simulating long-term impacts over many decades and centuries. This study relied on observations, which are better for showing shorter-term changes over 10 to 20 years. In shorter time spans, natural variations such as the recent slowdown in global surface temperature trends can have larger regional impacts on climate than human-caused warming.
Pauses of a decade or more in Earth's average surface temperature warming have happened before in modern times, with one occurring between the mid-1940s and late 1970s.
"In the long term, there is robust evidence of unabated global warming," Nieves said.
NASA uses the vantage point of space to increase our understanding of our home planet, improve lives and safeguard our future. NASA develops new ways to observe and study Earth's interconnected natural systems with long-term data records.
The agency freely shares this unique knowledge and works with institutions around the world to gain new insights into how our planet is changing.
______________________________________________________________________________________________________
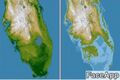
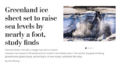
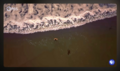
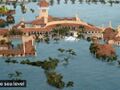
Sea-level Rise

Subcategories
This category has the following 18 subcategories, out of 18 total.
A
B
E
F
G
O
P
S
T
Pages in category "Oceans"
The following 90 pages are in this category, out of 90 total.
C
E
- Earth and Space, Politics
- Earth from NASA
- Earth Imaging-New Space
- Earth Right Now
- Earth Science
- Earth Science Research from Space
- Earth Science Vital Signs
- Ecolivia
- Environmental agreements
- Environmental Law, Rollbacks under Trump 2016-20
- Environmental Laws and Modern Environmental Movement
- Environmental movement
- Environmental protection
- ESA Living Planet Announcement - May 2022
- European Union Green Deal - Fit for 55
- Extinction
G
- George E. Brown Jr
- Glasgow Climate Summit - Pledges, Promises, Declarations - What's Next Up
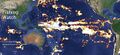
- Global Fishing Watch
- Google Earth
- Google Earth Timelapse
- GP360 NewPages
- Green Politics 360
- Green Stories of the Day
- Green Stories of the Day - GreenPolicy360 Archive
- GreenPolicy360 Archive Highlights 2013
- GreenPolicy360 Archive Highlights 2014
- GreenPolicy360 Archive Highlights 2015
- GreenPolicy360 Archive Highlights 2016
- GreenPolicy360 Archive Highlights 2017
- GreenPolicy360 Archive Highlights 2018
- GreenPolicy360 Archive Highlights 2019
- GreenPolicy360 Archive Highlights 2020
- GreenPolicy360 Archive Highlights 2023
- GreenPolicy360 Highlights
L
P
S
T
V
Media in category "Oceans"
The following 200 files are in this category, out of 686 total.
(previous page) (next page) EU unveils new climate change policy - July 14 2021 - 6.jpg 800 × 557; 89 KB
 EU unveils new climate change policy - July 14 2021 - 7.jpg 800 × 553; 92 KB
 EU unveils new climate change policy - July 14 2021 - 8.jpg 800 × 589; 91 KB
 Eukaryotic Cell SCU.jpg 716 × 1,024; 799 KB
 Eunice Foote Illustration climate.gov.jpg 620 × 296; 55 KB
 Europe heat wave - July 19 2022 - via Copernicus satellite.png 600 × 639; 704 KB
 Extreme temperature-world-May 2024.jpg 640 × 427; 105 KB
 ExxonMobil CO2 climatic response study - Graphic 1 - 1982.png 537 × 680; 150 KB
 ExxonMobil CO2 climatic response study - Graphic 2 - 1982.png 537 × 605; 112 KB
 FaceApp Florida.jpg 640 × 428; 40 KB
 Fact Checking organizations at work.jpg 800 × 390; 44 KB
 Facts about US Energy Use.jpg 697 × 600; 101 KB
 Facts Count-WaPo Reports-19127 false-misleading claims in 1226 days.jpg 601 × 489; 100 KB
 Fire Ants.png 601 × 600; 603 KB
 Floating adaptations - GCA - for sea-level rise - circa 2023.png 600 × 732; 273 KB
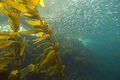
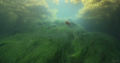
 Floating forest of kelp.jpg 940 × 263; 61 KB
 Floating Forest Project .png 773 × 461; 932 KB
 Floating Forest Project.png 1,106 × 604; 1,020 KB
 Floating Forests-Kelp -- Oceanlight.jpg 720 × 480; 137 KB
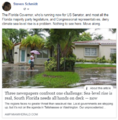
 Flooding in South Florida.png 640 × 742; 293 KB
 Florida 2024 Heating up and upset.jpg 460 × 581; 89 KB
 Florida and climate change denial.png 640 × 192; 46 KB
 Florida governor and legislature strike climate science - 2024.png 640 × 105; 42 KB
 Florida Keys sea surface temps for 2023 (as of July).png 480 × 585; 287 KB
 Florida ocean water temp south of Everglades tops 99 F. degrees.png 480 × 564; 128 KB
 Florida sea surface water in the Keys area tops 100 degree F.jpg 640 × 257; 58 KB
 FOOD.jpg 983 × 311; 117 KB
 Fox on Earth Day 2023.jpg 640 × 275; 58 KB
 From 1968 to 1992 -- and the Journey continues....png 572 × 851; 320 KB
 From Laudato Si protecting diversity of life.jpg 800 × 784; 118 KB
 From Reid Wiseman Earth Ocean Patterns.png 941 × 578; 715 KB
 G Earth Outreach.jpg 800 × 412; 44 KB
 Gavin in Glasgow - Nov 10 2021.png 728 × 600; 378 KB
 George Brown, Sci Com't.jpg 200 × 200; 7 KB
 GHG forcings 1750-2020.png 531 × 531; 94 KB
 GHG ppt concentrations 1975-2020.jpg 640 × 361; 69 KB
 Gistemp 1979-2019.png 750 × 491; 335 KB
 Glasgow-Climate Conference News-Nov 6, 2021.png 600 × 800; 290 KB
 Global Biodiversity Information-Data.png 501 × 266; 124 KB
 Global Changes in temperature 1850-2020.jpg 480 × 480; 152 KB
 Global Climate Change textbook-Edition2.jpg 604 × 680; 96 KB
 Global climate conferences and GHG increases.jpg 793 × 801; 56 KB
 Global Climate Dashboard - NOAA - Climate.gov.png 630 × 480; 165 KB
 Global climate dashboard-NOAA climate.gov.jpg 521 × 221; 45 KB
 Global climate dashboard-www.climate.gov.jpg 800 × 489; 100 KB
 Global Climate Dashboard.jpg 800 × 529; 101 KB
 Global Climate Strike - RU.jpg 450 × 804; 116 KB
 Global Fishing Watch 2.jpg 266 × 247; 26 KB
 Global Fishing Watch.jpg 1,246 × 569; 205 KB
 Global fossil fuel emissions - in a lifetime graphic.png 600 × 657; 233 KB
 Global Green New Deal.jpg 427 × 640; 32 KB
 Global greenhouse gas emissions - 1980 - 2020.png 640 × 480; 158 KB
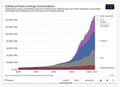 Global Primary Energy Consumption - 1800-2017.jpg 800 × 583; 65 KB
 Global sea surface temperature 1982-2024.png 800 × 823; 566 KB
 Global sea surface temperature graph as of 2024.png 800 × 455; 654 KB
 Global Stocktake, the first GST.jpg 800 × 905; 513 KB
 Global temperature change 1850-2016.gif 512 × 288; 1.38 MB
 Global temperature change 1901-2000.jpg 640 × 508; 47 KB
 Global temperature variations over past 200 years.jpg 640 × 360; 29 KB
 Global warming June 2024.jpg 640 × 174; 46 KB
 GlobalFishingWatch.jpg 577 × 820; 302 KB
 Good science needs good data .png 579 × 420; 223 KB
 Google Earth Hello2.png 800 × 375; 863 KB
 GP360 tagcloud2 m.png 531 × 324; 132 KB
 Great Barrier Reef - March 2020.jpg 800 × 296; 86 KB
 Great Barrier Reef 2020.jpg 517 × 445; 107 KB
 Great Barrier Reef dying.jpg 1,920 × 1,280; 706 KB
 Great Barrier Reef severe bleaching die-off.png 704 × 388; 630 KB
 Great-barrier-reef-2011 image credit, mike mccoy.jpg 2,560 × 1,600; 3.91 MB
 Greenhouse gas levels hit record - Reuters.jpg 600 × 696; 104 KB
 Greenland ice sheet set to raise sea level significantly.png 640 × 340; 223 KB
 GreenPolicy360 - May- 9-2024.png 800 × 406; 119 KB
 GreenPolicy360 - May-10-2024.png 790 × 694; 320 KB
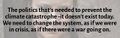 Greta - the politics thats needed.jpg 639 × 203; 38 KB
 Greta anger into action.png 800 × 419; 528 KB
 Greta Looks Back.PNG 504 × 437; 368 KB
 Greta Thunberg - Week 203 Climate Strike Banner.png 209 × 127; 51 KB
 Greta Thunberg - Week 203 Climate Strike.png 554 × 601; 488 KB
 Group on Earth Observations.JPG 546 × 418; 33 KB
 Guarding Earths Water - from Space.jpg 578 × 496; 102 KB
 Gulf Stream in Critical Danger.pdf ; 181 KB
 Haiku poems - Owl against a dusk sky - via Haiku Foundation.png 514 × 413; 144 KB
 Haikubox via RM citizen science.png 600 × 640; 466 KB
 Hansen testimony WaPo front page.jpg 480 × 210; 40 KB
 Hansen-testimony-1988.jpg 350 × 257; 42 KB
 Heat hitting billions.png 614 × 690; 509 KB
 High Seas Treaty agreement - March 4 2023.png 617 × 498; 53 KB
 Himawari Earth water vapor dynamics.png 768 × 774; 917 KB
 Historic climate-clean energy vote in US Congress August 12 2022.jpeg 800 × 775; 384 KB
 Historic photographs - Humble Oil TX - Exxon.png 591 × 596; 548 KB
 House passes biggest climate investment in U.S. history.png 625 × 480; 114 KB
 How satellites monitor climate change circa 2016.png 599 × 327; 0 bytes
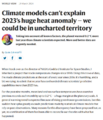 Huge heat anomaly in 2023 - by Gavin Schmidt.png 735 × 857; 172 KB
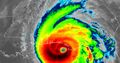 Hurricane Michael October 2018.jpg 600 × 314; 48 KB
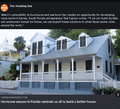 Hurricane-Proofing-Home-2024-Miami-Florida.png 658 × 600; 652 KB
 Hurricanes - Typhoons via NASA data.png 764 × 924; 1,022 KB
 I Am Greta - the Documentary.jpg 387 × 485; 30 KB
 I Am Greta Marching.jpg 800 × 534; 80 KB
 IEA - Support for Fossil Fuels - re 2021.jpg 559 × 800; 143 KB
 IEA energy chart - 2023.jpg 600 × 600; 68 KB
 IEA News 1.jpg 480 × 400; 64 KB
 IEA News 2.jpg 480 × 475; 55 KB
 IEA News 3.jpg 480 × 496; 57 KB
 IEA News 4.jpg 480 × 530; 57 KB
 IEA News 5.jpg 480 × 539; 62 KB
 IMO Headquarters - photo via NYT.jpg 237 × 368; 22 KB
 In nature, nothing exists alone.jpg 500 × 357; 26 KB
 In the smallest creatures god.png 748 × 149; 232 KB
 INaturalist butterfly.jpg 1,024 × 683; 202 KB
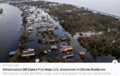 Infrastructure Bill and Climate Resilience - A Step Forward.png 640 × 403; 526 KB
 Intertidal Zone.png 800 × 474; 489 KB
 Interview w Mayor of South Miami 2.png 749 × 387; 289 KB
 Invading Seas warning 2024.png 757 × 587; 669 KB
 IPCC Report - Feb 2022.jpg 448 × 291; 113 KB
 IPCC report August 9-2021 (1).jpg 745 × 380; 156 KB
 IPCC report August 9-2021 (2).jpg 745 × 428; 171 KB
 It's hot in South Florida - July 2023.jpg 480 × 537; 92 KB
 It's Hot the Times UK Says... Act Now or else - July 2022.png 800 × 416; 568 KB
 James Hansen 2024.jpg 600 × 658; 110 KB
 January-May 2020 temp anomaly.jpg 680 × 380; 54 KB
 Jason2.jpg 416 × 200; 61 KB
 Jason3-16-2.jpg 600 × 236; 54 KB
 Jerry Brown re EPA - 19 June 2019.jpg 699 × 798; 126 KB
 Joe Biden is projected winner Nov7-2020.jpg 343 × 120; 26 KB
 John Kerry - Climate Envoy - 2021-09-26.png 640 × 410; 349 KB
 Journey of a Climate Pixel - May 2022.png 800 × 399; 114 KB
 July 14, 2018 - hello down there.png 524 × 467; 290 KB
 June 2019 - NASA GISS data - hottest on record.jpg 640 × 560; 58 KB
 Katharine Hayhoe - Nov 26, 2019.jpg 508 × 466; 80 KB
 Kelp forest off Calif coast collapsing.jpg 773 × 681; 155 KB
 Kelp NOAA credit Robert Schwemmer.jpg 450 × 299; 193 KB
 Kim Cobb - Georgia Tech professor of climate science.jpeg 800 × 533; 87 KB
 LA Times - July 2023 on the world's response to the climate crisis-1a.png 800 × 1,011; 657 KB
 LA Times on the world's response to the climate crisis-2.png 800 × 651; 297 KB
 LA Times on the world's response to the climate crisis-3.png 800 × 806; 302 KB
 LA Times on the world's response to the climate crisis-4.png 800 × 896; 321 KB
 LANDSAT - NASA.jpg 622 × 415; 95 KB
 Landsat 50th anniv Sept 2016.jpg 800 × 456; 94 KB
 Landsat 9 about to launch.png 420 × 721; 355 KB
 Landsat 9 Launches - 1.jpg 600 × 693; 128 KB
 Landsat 9 Launches - 2.jpg 600 × 737; 250 KB
 Landsat at 50.png 800 × 713; 345 KB
 Landsat Image Gallery.jpg 800 × 766; 187 KB
 Landsat memories.png 535 × 473; 159 KB
 Launch into Space.jpg 800 × 717; 50 KB
 LDCs face the climate crisis, raise the alarm - Nov 2021.png 419 × 226; 126 KB
 Le Grand Bleu.png 738 × 1,107; 1.52 MB
 Leah Stokes - UCSB - Prof Climate and Energy Policy.png 640 × 476; 295 KB
 Living Earth.png 441 × 183; 106 KB
 Living-Shoreline.png 800 × 367; 128 KB
 LivingEarth2.png 800 × 503; 478 KB
 LivingShorelines Graph.png 680 × 375; 73 KB
 LMDCs make their case at the Glasgow climate summit.png 427 × 480; 259 KB
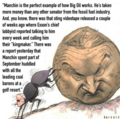
 Manchin kills the Biden climate plan.jpg 800 × 438; 71 KB
 Manchin News - Dec 20 2021.png 600 × 588; 307 KB
 Manchin News 2 - Dec 20 2021.png 600 × 600; 329 KB
 Mangroves 'green wall' in China.png 600 × 600; 466 KB
 Mangroves regulate flooding - EDF.png 568 × 473; 328 KB
 Map of the World wiki commons m.png 679 × 314; 18 KB
 Map of the World wiki commons s.png 339 × 157; 13 KB
 Map of the World wiki commons.png 1,357 × 628; 19 KB
 Mapping changes in global temperature 1850-2022.png 656 × 680; 180 KB
 Mapping the Earth with Google Earth Outreach.jpg 640 × 648; 109 KB
 Mar a lagoon tba.jpg 540 × 405; 40 KB
 March for Science-1.png 800 × 291; 596 KB
 Mares Kelp 3.png 903 × 476; 869 KB
 Mares Kelp.png 903 × 476; 532 KB
 Mascot for Glasgow intl climate conference.jpg 575 × 396; 76 KB
 Mauna Loa Observatory CO2 - April 2021 - New record high.jpg 656 × 600; 55 KB
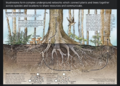
 Maya Lin Ghost Forest 5-17-2021.jpg 618 × 454; 123 KB
 McKibben re Manchin - Dec 2021.png 370 × 368; 261 KB
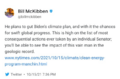 McKibben reaction to Manchin blocking Biden's climate plan.png 640 × 423; 140 KB
 Memories of Big Science advocates in the US Congress.jpg 583 × 279; 87 KB
 Methane cuts pledge - COP27.png 399 × 336; 164 KB
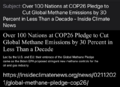 Methane emissions to be cut - COP26 pledges.png 640 × 464; 140 KB
 Methane Reduction proposal passes in EU Parliament - May 2023.png 620 × 600; 552 KB
 MethaneSat - 1.jpg 350 × 336; 58 KB
 MethaneSat - 2.PNG 448 × 336; 172 KB
 MethaneSat - 3.PNG 448 × 303; 248 KB
 Methods to enforce climate pledges-NDCs - Dec 2021.png 539 × 480; 333 KB
 Miami region sea level rise.gif 618 × 318; 191 KB
 Miami Reminder.jpg 411 × 292; 52 KB
 Miami sea level rise conf-May2018.jpg 800 × 600; 53 KB
 Miami-beach-waterworld-david-kamp.jpg 900 × 651; 222 KB
 Michael Mann - Susan Joy Hassol after Glasgow.jpg 460 × 1,616; 299 KB
 MLT Geospace - the Edge.jpg 800 × 600; 22 KB
 Monitoring Greenhouse Gases from Satellite Missions 2021-2030.png 801 × 386; 143 KB
 Montreal Protocol - effects study 2021.jpg 640 × 401; 76 KB
 Move along Florida-May 2018.png 448 × 454; 342 KB
 Moving to Higher Ground.png 568 × 473; 307 KB
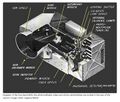 Multispectral Scanning Systen - MSS.jpg 688 × 587; 103 KB
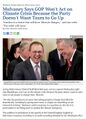 Mulvaney says no lifestyle change.jpg 561 × 779; 128 KB
 Mushroom life in the forest.png 640 × 458; 626 KB


.png)


.jpg)
.jpg)


