Category:Oceans

Ocean's hidden world of plankton revealed in 'enormous database' / May 2015 -- http://www.bbc.com/news/science-environment-32831814
____________________________________________________________________________________________________________________
"Green" issues make headlines these days, but many seem unaware that without the "blue" there could be no green, no life on Earth and therefore none of the other things that humans value. Water--the blue--is the key to life."
-- Sylvia A. Earle, "The World Is Blue: How Our Fate and the the Ocean's Are One", National Geographic Publications, 2009
○ ○ ○ ○ ○ ○ ○ ○ ○ ○ ○ ○ ○ ○ ○ ○ ○ ○ ○ ○ ○ ○ ○ ○ ○ ○ ○ ○ ○ ○
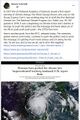
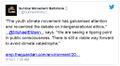
Global trends show seabird populations dropped 70 per cent since 1950s
“Seabirds are particularly good indicators of the health of marine ecosystems,” said Paleczny. ”When we see this magnitude of seabird decline, we can see there is something wrong with marine ecosystems. It gives us an idea of the overall impact we’re having.”
The dramatic decline is caused by a variety of factors including overfishing of the fish seabirds rely on for food, birds getting tangled in fishing gear, plastic and oil pollution, introduction of non-native predators to seabird colonies, destruction and changes to seabird habitat, and environmental and ecological changes caused by climate change.
Seabirds tend to travel the world’s oceans foraging for food over their long lifetimes, and return to the same colonies to breed. Colony population numbers provide information to scientists about the health of the oceans the birds call home.
http://journals.plos.org/plosone/article?id=10.1371/journal.pone.0129342
______________________________________________________________________________________________________
https://www.youtube.com/watch?v=lQK2iKn3YkA&feature=youtu.be
______________________________________________________________________________________________________
July 9, 2015
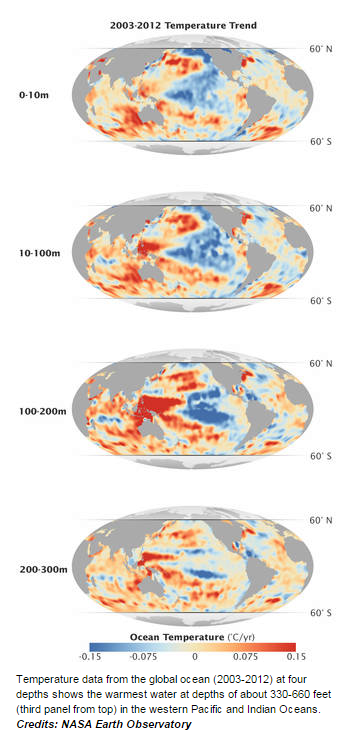
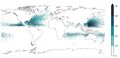
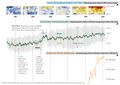
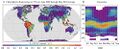
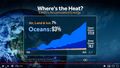
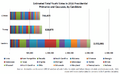
NASA Study Finds Indian, Pacific Oceans Temporarily Hide Global Warming
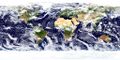
-- The new study used ocean temperature measurements from a global array of 3,500 Argo floats and other ocean sensors.
-- Temperature data from the global ocean (2003-2012) at four depths
-- Via NASA Earth Observatory http://www.nasa.gov/earth
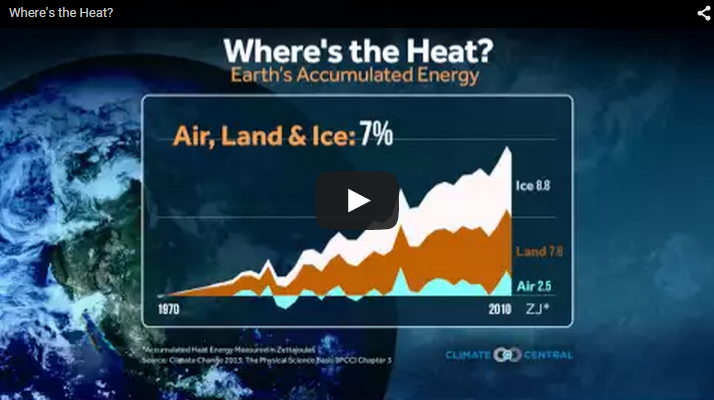
A new NASA study of ocean temperature measurements shows in recent years extra heat from greenhouse gases has been trapped in the waters of the Pacific and Indian oceans. Researchers say this shifting pattern of ocean heat accounts for the slowdown in the global surface temperature trend observed during the past decade. Researchers Veronica Nieves, Josh Willis and Bill Patzert of NASA’s Jet Propulsion Laboratory (JPL), Pasadena, California, found a specific layer of the Indian and Pacific oceans between 300 and 1,000 feet (100 and 300 meters) below the surface has been accumulating more heat than previously recognized. They also found the movement of warm water has affected surface temperatures. The result was published Thursday in the journal Science.
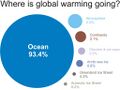
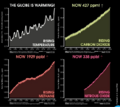
During the 20th century, as greenhouse gas concentrations increased and trapped more heat energy on Earth, global surface temperatures also increased. However, in the 21st century, this pattern seemed to change temporarily.
"Greenhouse gases continued to trap extra heat, but for about 10 years starting in the early 2000s, global average surface temperature stopped climbing, and even cooled a bit," said Willis.
In the study, researchers analyzed direct ocean temperature measurements, including observations from a global network of about 3,500 ocean temperature probes known as the Argo array. These measurements show temperatures below the surface have been increasing.
The Pacific Ocean is the primary source of the subsurface warm water found in the study, though some of that water now has been pushed to the Indian Ocean. Since 2003, unusually strong trade winds and other climatic features have been piling up warm water in the upper 1,000 feet of the western Pacific, pinning it against Asia and Australia.
"The western Pacific got so warm that some of the warm water is leaking into the Indian Ocean through the Indonesian archipelago," said Nieves, the lead author of the study.
The movement of the warm Pacific water westward pulled heat away from the surface waters of the central and eastern Pacific, which resulted in unusually cool surface temperatures during the last decade. Because the air temperature over the ocean is closely related to the ocean temperature, this provides a plausible explanation for the global cooling trend in surface temperature.
Cooler surface temperatures also are related to a long-lived climatic pattern called the Pacific Decadal Oscillation, which moves in a 20 to 30 year cycle. It has been in a cool phase during the entire time surface temperatures showed cooling, bringing cooler-than-normal water to the eastern Pacific and warmer water to the western side. There currently are signs the pattern may be changing to the opposite phase, with observations showing warmer-than-usual water in the eastern Pacific.
"Given the fact the Pacific Decadal Oscillation seems to be shifting to a warm phase, ocean heating in the Pacific will definitely drive a major surge in global surface warming," Nieves said.
Previous attempts to explain the global surface temperature cooling trend have relied more heavily on climate model results or a combination of modeling and observations, which may be better at simulating long-term impacts over many decades and centuries. This study relied on observations, which are better for showing shorter-term changes over 10 to 20 years. In shorter time spans, natural variations such as the recent slowdown in global surface temperature trends can have larger regional impacts on climate than human-caused warming.
Pauses of a decade or more in Earth's average surface temperature warming have happened before in modern times, with one occurring between the mid-1940s and late 1970s.
"In the long term, there is robust evidence of unabated global warming," Nieves said.
NASA uses the vantage point of space to increase our understanding of our home planet, improve lives and safeguard our future. NASA develops new ways to observe and study Earth's interconnected natural systems with long-term data records.
The agency freely shares this unique knowledge and works with institutions around the world to gain new insights into how our planet is changing.
______________________________________________________________________________________________________
<Sea-level Rise
Subcategories
This category has the following 18 subcategories, out of 18 total.
A
B
E
F
G
O
P
S
T
Pages in category "Oceans"
The following 90 pages are in this category, out of 90 total.
C
E
- Earth and Space, Politics
- Earth from NASA
- Earth Imaging-New Space
- Earth Right Now
- Earth Science
- Earth Science Research from Space
- Earth Science Vital Signs
- Ecolivia
- Environmental agreements
- Environmental Law, Rollbacks under Trump 2016-20
- Environmental Laws and Modern Environmental Movement
- Environmental movement
- Environmental protection
- ESA Living Planet Announcement - May 2022
- European Union Green Deal - Fit for 55
- Extinction
G
- George E. Brown Jr
- Glasgow Climate Summit - Pledges, Promises, Declarations - What's Next Up
- Global Fishing Watch
- Google Earth
- Google Earth Timelapse
- GP360 NewPages
- Green Politics 360
- Green Stories of the Day
- Green Stories of the Day - GreenPolicy360 Archive
- GreenPolicy360 Archive Highlights 2013
- GreenPolicy360 Archive Highlights 2014
- GreenPolicy360 Archive Highlights 2015
- GreenPolicy360 Archive Highlights 2016
- GreenPolicy360 Archive Highlights 2017
- GreenPolicy360 Archive Highlights 2018
- GreenPolicy360 Archive Highlights 2019
- GreenPolicy360 Archive Highlights 2020
- GreenPolicy360 Archive Highlights 2023
- GreenPolicy360 Highlights
L
P
S
T
V
Media in category "Oceans"
The following 63 files are in this category, out of 686 total.
(previous page) (next page) Tracking Biden's Environmental Record - WaPo - Feb 2021.jpg 766 × 326; 64 KB
 Tracking Biden's Environmental Record - WaPo listing - Feb 2021.jpg 588 × 397; 35 KB
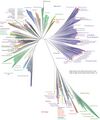 Tree of Life nmicrobiol201648-f1 via Nature.jpg 695 × 833; 98 KB
 Tree of Life on Hand.jpg 336 × 448; 70 KB
 Tropical Cyclone - Hurricane Population Displacement Risks.jpg 800 × 385; 56 KB
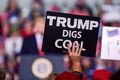 Trump digs coal-2.jpg 800 × 533; 46 KB
 Trump promise to oil ceo gathering - 1.png 440 × 108; 19 KB
 Trump promise to oil ceo gathering - 2.png 480 × 495; 291 KB
 Trump promise to oil ceo gathering - 3.png 480 × 284; 270 KB
 Trump promise to oil ceo gathering - 4.png 480 × 480; 333 KB
 UCS-EPA-Oct16,2017.png 492 × 544; 148 KB
 UN - Tipping Point for Climate Action.png 690 × 600; 601 KB
 UN Climate Summit News (1).pdf ; 1.85 MB
 UN Mapping the World.png 740 × 477; 584 KB
 UN NDC Registry - website database.png 798 × 392; 575 KB
 Unified sea level rise - Southeast Florida.jpg 800 × 418; 70 KB
 Unprecedented report - IPCC Aug-9-2021.jpg 800 × 666; 165 KB
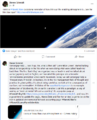
 Update - James Hansen July 2023 'We are fools'.png 595 × 800; 610 KB
 US 2020-billion-dollar-disasters-map.png 800 × 480; 259 KB
 US Annual Temperatures 1901-2020 Average Comparison.jpg 604 × 843; 242 KB
 US EPA to reverse methane rules.jpg 592 × 745; 175 KB
 US Public Law 95-367.png 732 × 469; 149 KB
 US Quits Climate Accord.jpg 795 × 233; 40 KB
- US Role George E Brown 2.pdf ; 151 KB
- US Role George E Brown 3.pdf ; 157 KB
 Usable climate science is adaptation science-Adam Sobel May 2021.jpg 702 × 664; 155 KB
 USC Daily Trojan Sen Nelson speech day after first Earth Day .jpg 640 × 384; 97 KB
 Vegans and animal agriculture.jpg 320 × 320; 16 KB
 Venice flooding.png 530 × 516; 109 KB
 Via annie leonard.jpg 1,280 × 720; 140 KB
 Viaggi-sanfrancesco-assisi.jpg 618 × 401; 66 KB
 Virtual Earth cover.png 800 × 479; 833 KB
 Vorsorgeprinzip at GreenPolicy360 - sjs.png 611 × 758; 164 KB
 Wallace Smith Broecker.jpg 525 × 424; 93 KB
 Warming-ocean-threatens-sea-life 2.jpg 929 × 661; 344 KB
 Watching the Planet Breathe.jpg 560 × 380; 173 KB
 Watching the Planet Breathe3.jpg 1,000 × 405; 290 KB
 Water - Earth.JPG 600 × 616; 29 KB
 Water covers 70% of earths surface 1024x512.jpg 1,024 × 512; 223 KB
 Waves, rough, stormy weather.jpg 800 × 540; 72 KB
 We are all in this together-IPCC report-August 2021.jpg 513 × 768; 183 KB
 We must flatten the curve, yes ... August 2020.jpg 800 × 421; 99 KB
 Wheeler-Mulvaney-repeal of Clean Power Plan-June19,2019.jpg 800 × 640; 145 KB
 When your house is on fire.jpg 589 × 473; 77 KB
 Where is global warming.jpg 1,024 × 768; 51 KB
 Where is the heat - IPCC.jpg 800 × 451; 75 KB
 Which countries pollute the most ~2017.jpg 800 × 422; 69 KB
 Who really invented the climate stripes - Climate Change Education.png 600 × 600; 234 KB
 Wildlife silence. sound ecologists warning.jpg 640 × 232; 63 KB
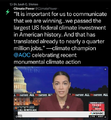 Winning on the climate legis - AOC.png 480 × 519; 249 KB
 World Map - Mercator projection v Google maps.jpg 800 × 545; 101 KB
 Worldwide view of oceans phytoplankton earth observatory nasa.gif 540 × 270; 0 bytes
 WV v EPA SCOTUS poll - June 27 2022 before court decision.png 623 × 480; 126 KB
 Youth Climate Movement.jpg 516 × 284; 79 KB
 Youth vote estimates 2016 primary.png 800 × 490; 257 KB
 Zack Labe - climate viz - June 2024.png 675 × 600; 261 KB


