Category:Air Quality: Difference between revisions
Siterunner (talk | contribs) No edit summary |
Siterunner (talk | contribs) No edit summary |
||
| (10 intermediate revisions by the same user not shown) | |||
| Line 1: | Line 1: | ||
[[File:Featured.png]] | [[File:Featured.png]] | ||
| Line 6: | Line 6: | ||
:::[[File:Clouds.jpg]] | :::[[File:Clouds.jpg]] | ||
:::<small>[https://www.greenpolicy360.net/w/Category:Air_Pollution Air Pollution]</small> | |||
<big>'''The Clean Air Act'''</big> | |||
'''A Modern Era of Air Quality Regulations Begins''' | |||
'''Los Angeles is Out-in-Front in California and California is Out-in-Front in the US''' | |||
'''The US Air Quality Regulations to Limit Air Pollution Become the Model for the World''' | |||
* https://www.nrdc.org/resources/clean-air-acts-benefits-map | |||
''The Clean Air Act (CAA) has been limiting harmful air pollutants from cars and trucks, power plants, and industrial smokestacks, since the early 1970s, helping usher in a new era of clean air and improved public health. Today, the annual benefits from cleaner air include up to 370,000 avoided premature deaths, 189,000 fewer hospital admissions for cardiac and respiratory illnesses, and net economic benefits of up to $3.8 trillion for the U.S. economy. Moreover, the annual benefits of the CAA are up to 32 times greater than the cost of these regulations.'' | |||
[https://www.greenpolicy360.net/w/Category:Air_Pollution <big>More @GreenPolicy360 re: Air Pollution</big>] | |||
(GreenPolicy360 Siterunner / May 05, 2020: A tip of our hat to [https://www.greenpolicy360.net/w/George_E._Brown_Jr Congressman George E. Brown, from East Los Angeles] and a long time friend from back in the days, as the initial [https://www.greenpolicy360.net/w/File:Env_policy_laws_US_%27the_beginning%27_of_env_era.jpg US foundation of environmental laws] came to be... George's strong interest and belief that the 'dirtiest air in the world', that of Los Angeles with its post-war boom, with freeways, traffic, the 'LA basin' trapping the polluted air, had to be cleaned up if children were to grow up healthy. George often talked to me about this, and even would show me X-rays of lungs that doctors would show him demonstrating the damage smog was doing to Southern California's children. Representative Brown went on to be one of the main movers and shakers in writing and shepherding legislation through that became models for the world of what could be accomplished in improved air quality. Whether auto emission standards, mileage standards, engineering improvements, testing and monitoring air quality including the first generation of US earth science/atmospheric science missions and research from space, George was a powerful force in the US Congress and in California legislation. George Brown, from the 1960s to his sudden passing in 1999, envisioned and engineered environmental protection progress. George was a doer, not a political showboat. In his rumpled suit, and his pipe, rarely lit but usually used for gesturing almost as a theatrical prop, George was a character with deep character. I will always remember my friend.) | |||
'''Measuring & Monitoring from Space''' | |||
[[File:You can manage only what you can measure Dr David Crisp, OCO-2, June 2014 m.jpg]] | |||
Coronavirus impact on air quality in China, February 2020 | |||
* https://earthobservatory.nasa.gov/images/146362/airborne-nitrogen-dioxide-plummets-over-china | |||
* https://www.sciencedaily.com/releases/2015/12/151214185548.htm | |||
Nitrogen Dioxide /NO2 | |||
* https://earthobservatory.nasa.gov/images/87392/a-decade-of-change-for-nitrogen-dioxide | |||
'''Tracking Air Quality of 195 Cities''' | |||
''Using new, high-resolution global satellite maps of air quality indicators, NASA scientists tracked air pollution trends over the last decade in various regions and 195 cities around the globe. The findings were presented at the American Geophysical Union meeting in San Francisco and published in the Journal of Geophysical Research.'' | |||
''"With the new high-resolution data, scientists are now able to zoom down to study pollution changes within cities, including from some individual sources, like large power plants".'' | |||
''Previous work using satellites at lower resolution missed variations over short distances. This new space-based view offers consistent information on pollution for cities or countries that may have limited ground-based air monitoring stations. The resulting trend maps tell a unique story for each region.'' | |||
''The United States and Europe are among the largest emitters of nitrogen dioxide. Both regions also showed the most dramatic reductions between 2005 and 2014. Nitrogen dioxide has decreased from 20 to 50 percent in the United States, and by as much as 50 percent in Western Europe. Researchers concluded that the reductions are largely due to the effects of environmental regulations that require technological improvements to reduce pollution emissions from cars and power plants.'' | |||
''China, the world's growing manufacturing hub, saw an increase of 20 to 50 percent in nitrogen dioxide, much of it occurring over the North China Plain. Three major Chinese metropolitan areas -- Beijing, Shanghai, and the Pearl River Delta -- saw nitrogen dioxide reductions of as much as 40 percent.'' | |||
NASA | Air Quality Observations from Space | |||
[[File:China air 2005 2014.jpg]] | |||
[https://mailchi.mp/emissionsanalytics/burningissue <big>'''''Emissions Analytics, Air Quality, Tires/Tyres, Micro-particulates'''''</big>] | |||
'''NASA | Air Quality Observations from Space''' | |||
* https://airquality.gsfc.nasa.gov/ | * https://airquality.gsfc.nasa.gov/ | ||
NASA | Video Shows Asian Air Pollution Moving Across the Globe | '''NASA | Video Shows Asian Air Pollution Moving Across the Globe''' | ||
* https://www.youtube.com/watch?v=qtAd4p22NRo | * https://www.youtube.com/watch?v=qtAd4p22NRo | ||
<big>[[Earth Science Research from Space]]</big> | |||
<big><big>'''[[Earth Science Research from Space]]'''</big></big> | |||
NASA | Human Fingerprint on Global Air Quality | '''NASA | Human Fingerprint on Global Air Quality''' | ||
* https://www.youtube.com/watch?v=aMnDoXuTGS4 | * https://www.youtube.com/watch?v=aMnDoXuTGS4 | ||
··········································································· | |||
Latest revision as of 17:28, 21 August 2024
The Clean Air Act
A Modern Era of Air Quality Regulations Begins
Los Angeles is Out-in-Front in California and California is Out-in-Front in the US
The US Air Quality Regulations to Limit Air Pollution Become the Model for the World
The Clean Air Act (CAA) has been limiting harmful air pollutants from cars and trucks, power plants, and industrial smokestacks, since the early 1970s, helping usher in a new era of clean air and improved public health. Today, the annual benefits from cleaner air include up to 370,000 avoided premature deaths, 189,000 fewer hospital admissions for cardiac and respiratory illnesses, and net economic benefits of up to $3.8 trillion for the U.S. economy. Moreover, the annual benefits of the CAA are up to 32 times greater than the cost of these regulations.
More @GreenPolicy360 re: Air Pollution
(GreenPolicy360 Siterunner / May 05, 2020: A tip of our hat to Congressman George E. Brown, from East Los Angeles and a long time friend from back in the days, as the initial US foundation of environmental laws came to be... George's strong interest and belief that the 'dirtiest air in the world', that of Los Angeles with its post-war boom, with freeways, traffic, the 'LA basin' trapping the polluted air, had to be cleaned up if children were to grow up healthy. George often talked to me about this, and even would show me X-rays of lungs that doctors would show him demonstrating the damage smog was doing to Southern California's children. Representative Brown went on to be one of the main movers and shakers in writing and shepherding legislation through that became models for the world of what could be accomplished in improved air quality. Whether auto emission standards, mileage standards, engineering improvements, testing and monitoring air quality including the first generation of US earth science/atmospheric science missions and research from space, George was a powerful force in the US Congress and in California legislation. George Brown, from the 1960s to his sudden passing in 1999, envisioned and engineered environmental protection progress. George was a doer, not a political showboat. In his rumpled suit, and his pipe, rarely lit but usually used for gesturing almost as a theatrical prop, George was a character with deep character. I will always remember my friend.)
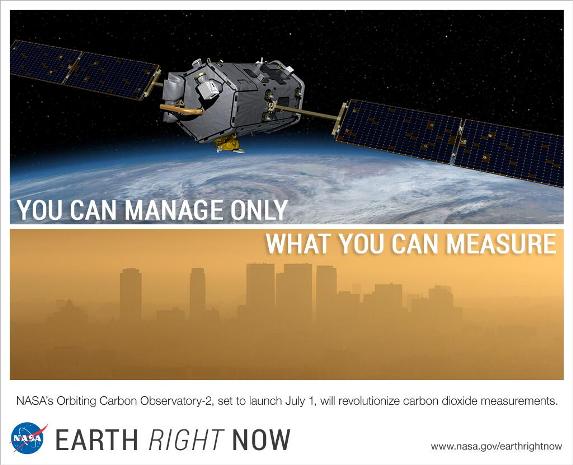
Measuring & Monitoring from Space
Coronavirus impact on air quality in China, February 2020
Nitrogen Dioxide /NO2
Tracking Air Quality of 195 Cities
Using new, high-resolution global satellite maps of air quality indicators, NASA scientists tracked air pollution trends over the last decade in various regions and 195 cities around the globe. The findings were presented at the American Geophysical Union meeting in San Francisco and published in the Journal of Geophysical Research.
"With the new high-resolution data, scientists are now able to zoom down to study pollution changes within cities, including from some individual sources, like large power plants".
Previous work using satellites at lower resolution missed variations over short distances. This new space-based view offers consistent information on pollution for cities or countries that may have limited ground-based air monitoring stations. The resulting trend maps tell a unique story for each region.
The United States and Europe are among the largest emitters of nitrogen dioxide. Both regions also showed the most dramatic reductions between 2005 and 2014. Nitrogen dioxide has decreased from 20 to 50 percent in the United States, and by as much as 50 percent in Western Europe. Researchers concluded that the reductions are largely due to the effects of environmental regulations that require technological improvements to reduce pollution emissions from cars and power plants.
China, the world's growing manufacturing hub, saw an increase of 20 to 50 percent in nitrogen dioxide, much of it occurring over the North China Plain. Three major Chinese metropolitan areas -- Beijing, Shanghai, and the Pearl River Delta -- saw nitrogen dioxide reductions of as much as 40 percent.
Emissions Analytics, Air Quality, Tires/Tyres, Micro-particulates
NASA | Air Quality Observations from Space
NASA | Video Shows Asian Air Pollution Moving Across the Globe
Earth Science Research from Space
NASA | Human Fingerprint on Global Air Quality
···········································································
Tackling climate change could save millions of lives
World Health Organization / Special report on health and climate change
"The most direct link between climate change and ill health is air pollution."
"Burning fossil fuels for power, transport and industry is the main source of the carbon emissions that are driving climate change and a major contributor to health-damaging air pollution, which every year kills over seven million people due to exposure inside and outside their homes," according to the health report.
·····························
AirVisual / Monitor Your Air Quality
AirNow / International Air Quality
World Air Quality Index / World's Air Pollution: Real-time Air Quality Index
- Particulate air pollution is the single greatest threat to human health globally.
The AQLI establishes that particulate air pollution cuts the average person’s life short by nearly 2 years—more than devastating communicable diseases like tuberculosis and HIV/AIDS, behavioral killers like cigarette smoking, and even war.
Particulate matter (PM) refers to solid and liquid particles – soot, smoke, dust, and others – that are suspended in the air. When the air is polluted with PM, these particles enter the respiratory system along with the oxygen that the body needs.
When PM is breathed into the nose or mouth, each particle’s fate depends on its size: the finer the particles, the farther into the body they penetrate. PM10, particles with diameters smaller than 10 micrometers (μm) whose concentration in the air is included in measures of “total suspended matter” (TSP), are small enough to pass through the hairs in the nose. They travel down the respiratory tract and into the lungs, where the metal elements on the surface of the particles oxidize lung cells, damaging their DNA and increasing the risk of cancer.[1] The particles’ interactions with lung cells can also lead to inflammation, irritation, and blocked airflow, increasing the risk of or aggravating lung diseases that make breathing difficult, such as chronic obstructive pulmonary disorder (COPD), cystic lung disease, and bronchiectasis.
More deadly is an even smaller classification: PM2.5, or particles with diameter less than 2.5 μm—just 3 percent the diameter of a human hair. In addition to contributing to risk of lung disease, PM2.5 particles pass even deeper into the lungs’ alveoli, the blood vessel-covered air sacs in which the bloodstream exchanges oxygen for carbon dioxide. Once PM2.5 particles enter the bloodstream via the alveoli, they inflame and constrict blood vessels or dislodge fatty plaque, increasing blood pressure or creating clots. This can block blood flow to the heart and brain, and over time, lead to stroke or heart attack. In recent years, researchers have even begun to observe that PM pollution is associated with lower cognitive function. They speculate that PM2.5 in the bloodstream may cause the brain to age more quickly due to the inflammation. In addition, it may damage the brain’s white matter, which is what allows different regions of the brain to communicate. White matter damage, such as due to the decreased blood flow that PM2.5 may cause, has been linked to Alzheimer’s and dementia.
Though some particulates arise from natural sources such as dust, sea salt, and wildfires, most PM2.5 pollution is human-induced.
The fact that burning coal pollutes the air has been known for some time. Around 1300, King Edward I of England decided that the punishment for anyone who burned coal in his kingdom would be death. Today, fossil fuel combustion is the leading global source of anthropogenic PM2.5, acting through three distinct pathways:
First, because coal contains sulfur, coal-fired power plants and industrial facilities generate sulfur dioxide gas. Once in the air, the gas may react with oxygen and then ammonia in the atmosphere to form sulfate particulates.
Second, combustion that occurs at high temperatures, such as in vehicle engines and power plants, releases nitrogen dioxide, which undergoes similar chemical reactions in the air to form nitrate particulates.
Finally, diesel engines, coal-fired power plants, and burning of coal for household fuel all involve incomplete combustion. In this type of combustion, not enough oxygen is present to generate the maximum amount of energy possible given the amount of fuel. Part of the excess carbon from the fuel becomes black carbon, a component of PM2.5 that is also the second- or third-most important contributor to climate change after carbon dioxide and perhaps methane....
2018
- #WorstAirQuality IN THE WORLD, CITIES
- 1. #Delhi
- 2. #Dakar
- 3. #Mumbai
- 4. #Beijing
- 5. #Johannesburg
- 6. #Jakarta
- 7. #Tehran
- 8. #Jerusalem
- 9. #Melbourne
- 10. #Lima
- 11. #Seoul
- 12. #Rio
- 13. #Bangkok
- 14. #Milan
- 15. #MexicoCity
- 16. #Tokyo
- 17. #Paris
- 18. #LA
- 19. #London
- 20. #NewYorkCity
······························
In the U.S., the election of Donald Trump in 2016 has resulted in an unprecedented assault of environmental standards and practices put together over the past half century. The costs of this deconstruction have yet to be fully calculated with a full cost accounting, but future generations will undoubtedly have a harsh judgment toward policies that deliver long-term damage. The decisions being made today are impacting clean air, clean water, climate change, health, locally and internationally.
SJS / Siterunner: Years ago the smog in LA was so thick and so persistent that the city was regarded as one of the worst cases of air pollution in the world. Out of that mix of environmental disaster, and damage to a generation of kids whose lungs were affected, came the beginnings of the modern environmental movement. Los Angeles and California were at the forefront of the first set of environmental laws, incl air quality. George E Brown, a mentor and friend for over 30 yrs, was a drafter of the original EPA legis and many other key initiatives that are now at the center of green politics. George would have had strong opinions about the latest moves in the US Congress (circa 2014-2017) to move away from the roll of science and roll back the EPA, environmental protections, the responses to climate change, and the leadership role of the United States that's critically important in today's world...
- Particulate matter can cause similar adverse respiratory consequences and also trigger a range of cardiovascular problems, including heart attacks, strokes, congestive heart failure, and reduced blood supply to the heart. These problems can result in increased hospital admissions or premature death. Particulate matter can also trigger premature birth, raise the risk of autism, stunt lung development in children, and increase the risk that they develop asthma. Recent studies also implicate particulate matter in an increased risk of dementia.
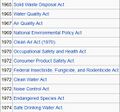
See a snapshot of the 'modern environmental movement' and first-gen environmental laws
The first generation of Air Quality / Air Pollution laws and regulations have, over the past fifty plus years, served as a green political model in the United States and globally.
Now, internationally, countries and cities are adopting "green best practices". Clean-up laws, regulations and technologies are improving energy, transportation, housing and key sectors of local/regional and national economies.
Much progress remains to be planned and accomplished.
Models for action are being shared and scientific monitoring is now being conducted worldwide.
Global atmospheric conditions connect all nations and the work to be done is international.
Air Quality Maps / Global
Video shows how air pollution spreads globally
···············································································································
"Air Pollution" @GreenPolicy360 -- https://www.greenpolicy360.net/w/Category:Air_Pollution
Join the environmental movement, act for clean air, clean water, healthy lives, quality of living
- A breathing app can change the world ...
○
Healthy Lungs Are Good
A Case Study
Atmotube: Portable Air Pollution Monitor
A Wearable (Digibody) prototype app to track carbon footprints
○
Aclima air pollution sensors mounted on cars
Google Green Blog -- Make the Invisible Visible by Mapping Air Quality
Aclima-Google-City air quality mapping
"The partnership enables a paradigm-shift in environmental awareness by equipping Street View cars with Aclima’s mobile sensing platform to see the air around us in ways never before possible. Three Street View cars took measurements of nitrogen dioxide, nitric oxide, ozone, carbon monoxide, carbon dioxide, methane, black carbon, particulate matter, and Volatile Organic Compounds (VOCs) -- air pollutants which can affect human health or climate change." (from the press release announcement)
Our GreenPolicy360 proposals from 2014/15 have come to be !
Here we are in December 2018 !!
Do You Know What You’re Breathing?
Acting to measure the air pollution around you. Acting to make a difference in the air you and your family breathe.
As climate change reports become increasingly dire, and as wildfires tear across the American West, and as trust in the federal government’s air quality oversight fades, thousands of people around the country are taking air measurements into their own hands.
Installed on a porch, a console table or hooked to a backpack, these small, sleek and increasingly inexpensive devices measure hyper-local air quality. They are marketed to the discerning and alarmed consumer. Some have begun to self-identify as “breathers.”
The Atmotube and PlumeLab’s Flow are small and meant to be carried around, testing the air as a person walks or bikes, helping people plan routes that avoid bad air. The Awair looks like an old-timey radio and sits on a counter to test indoor air. Aeroqual’s particulate monitor, one of the most advanced, looks like an enormous old-fashioned cellphone.
But the monitor most intriguing local government environmental protection agencies and civilians alike is PurpleAir. It hooks up outside, connects to Wi-Fi, feeds into a global network and creates something like a guerrilla air quality monitoring network....
○
Citizen Crowdsourcing, Citizen Networking, Citizen Science in Action
- The Environmental Protection Agency Meets Citizen Science
○
- Wearable Devices / 'Digibody-type Personal Devices and Apps'
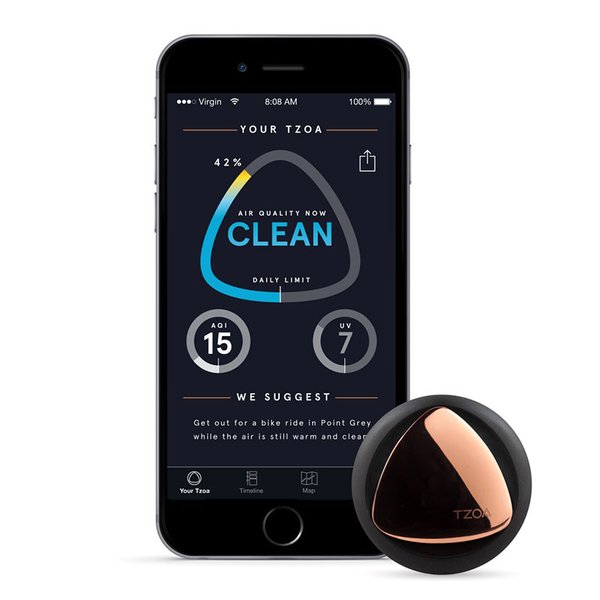
With Wearable Devices That Monitor Air Quality, Scientists Can Crowdsource Pollution Maps
Emerging technology means anyone with a smartphone can become a mobile environmental monitoring station !
http://www.mytzoa.com/#homepage
○
https://www.kickstarter.com/projects/741031201/airbeam-share-and-improve-your-air
http://pubs.acs.org/stoken/presspac/presspac/abs/10.1021/es505362x
○
Air Visibility Monitoring (Android app) - http://robotics.usc.edu/~mobilesensing/Projects/AirVisibilityMonitoring
Biodiversity Group - http://www.biodiversitygroup.org/
Citizen Science Alliance - http://www.citizensciencealliance.org/
Climate Change and Citizen Science - http://www.slideshare.net/CitizenScienceCentral/citizen-science-and-climate-change-west
Cyber Citizens - http://up.secondwavemedia.com/innovationnews/smartphone100913.aspx
Dark Sky Meter (iOS app) - http://www.darkskymeter.com/home-2/
Eight Apps that Turn Citizens into Scientists - http://www.scientificamerican.com/article/8-apps-that-turn-citizens-into-scientists/
Globe at Night (light pollution) - http://www.globeatnight.org/
Great Sunflower Project / Bees - http://www.greatsunflower.org/
iCoast (USGS) - http://coastal.er.usgs.gov/icoast/about.php
iSpot Nature (Open Lab/Open Univ) - http://www.ispotnature.org/communities/global
International Barcode of Life - http://ibol.org/
LeafSnap (Smithsonian) - http://leafsnap.com/
Loss of the Night (Light Pollution) - http://cosalux.de/#/en/portfolio-en/loss-of-the-night-android-app/
Marine Animal Identification Network (online template) - http://main.whoi.edu/report.cfm
Marine Debris Tracker - http://www.marinedebris.engr.uga.edu/
Mobile Apps for Citizen Science (via Smithsonian) - http://www.ssec.si.edu/blog/mobile-apps-for-citizen-science
NASA Earth Exchange (NEX platform for scientific collaboration, knowledge sharing and research for the Earth science community) - https://nex.nasa.gov/nex/
National Science Foundation (US/"Citizen Science") - http://www.nsf.gov/news/special_reports/science_nation/citizenscience.jsp
NestWatch - http://nestwatch.org/
NOAA - http://www.climate.gov/teaching/resources/climate-change-and-citizen-science
Nova Energy Lab (PBS-Harvard) - http://www.pbs.org/wgbh/nova/labs/lab/energy/
Ocean Spaces (monitoring marine protected areas) - http://oceanspaces.org/
Open Scientist - http://www.openscientist.org/p/citizen-science-for-your-phone.html
Open Tree (urban forest mapping) - https://www.opentreemap.org/
Open University Lab - http://www.open.ac.uk/researchprojects/open-science/
Project Noah (National Geographic) - http://www.projectnoah.org/
SatCam (iOS app) supports the Terra, Aqua, and Suomi NPP satellites - http://satcam.ssec.wisc.edu/
SciStarter (list of several hundred cit science projects) - http://scistarter.com/index.html / http://scistarter.com/blog/#sthash.ex9FXlZ3.dpbs
Scientific American - http://www.scientificamerican.com/citizen-science/
Sensr, Citizen Science app (Carnegie Mellon) - http://www.sensr.org/
TreeMap LA (TreePeople) - http://www.treepeople.org/ - https://www.treepeople.org/action
Union of Concerned Scientists, You + Your Computer = Carbon Detective - http://www.ucsusa.org/global_warming/what_you_can_do/climate-change-citizen-science.html#.VLgLJHv44Rk
US Global Change/Climate Assessment (Dec 2014) - http://www.globalchange.gov/news/open-government-data-more-resilient-natural-resources
- http://www.whitehouse.gov/blog/2014/12/09/unleashing-climate-data-and-innovation-more-resilient-ecosystems
- http://www.whitehouse.gov/sites/default/files/microsites/ostp/cdi-ecosystems-12-9.pdf
Water monitoring (http://www.wef.org/ education/kit) - https://www.lamotte.com/secure/wwmday/
Whale Song Project - http://whale.fm/
You can be a scientist too (EPA) - http://www.epa.gov/climatestudents/scientists/citizen-science.html
Zooniverse - https://www.zooniverse.org/
○
Healthy Earth Lungs Are Good
The Breathing Earth | Climate Change Data Visualization
(In the US) economic health and public health haven't been locked in a zero-sum battle. The air is indisputably cleaner today, even after decades of economic growth. As the Obama administration tries to apply the Clean Air Act to a new environmental problem — climate change — it's worth wondering if past performance ever guarantees future results.
An annual report on air quality from the American Lung Association includes a revealing chart that tracks the percentage change in air pollution, gross domestic product, vehicle-miles traveled, population, energy consumption, and carbon dioxide emissions since 1970, when President Richard Nixon signed the Clean Air Act.
The question before the world is whether we can send climate-warming pollutants in the same direction while unlinking carbon emissions from economic growth. At the heart of the economic argument against Obama's Clean Power Plan, which uses the EPA's authority to phase out the most polluting coal plants, is that we just can't afford it. An analysis commissioned by America's Power, a group representing the coal industry, predicts that Obama's plan would cause electricity prices to spike by double digits and could cost the economy up to $39 billion a year.
"I’ve doing this over 25 years," said Paul Billings, senior vice president of advocacy for the American Lung Association. "I’ve heard this from industry every single time EPA has tried to tighten a standard."
Early evidence from carbon-cutting programs suggests that economies are not left in ruins. Nine northeastern states would have produced 24 percent more emissions if they hadn't formed the Regional Greenhouse Gas Initiative in 2009. From 2009 to 2014, their combined GDP grew by about 8 percent. British Columbia enacted a carbon tax in 2008. Emissions per capita fell 12.9 percent below its pre-tax years—3.5 times larger than the overall decline in Canadian per capita emissions—and the province has not become an economic basket case.
The EPA has studied the effects of the Clean Air Act repeatedly. A first major review came in the 1990s, when researchers found that from 1970 to 1990, cumulative benefits—which include reductions in deaths and illnesses from asthma, heart attacks, and stroke — outweighed costs by an average ranging from $22.2 trillion to $563 billion... it's possible to reduce pollution without crimping economic growth, defying doomsayers' predictions.
○
One Day's Toxic Air News Pulled from the Headlines
February 10th, 2017
○
○
○
○
○
○
Decades ago Mexico City's air pollution was so poor, birds would fall out of the sky -- dead. Locals said living there was like smoking two packs of cigarettes a day, according to one report. In response, Mexico City took several steps to try to improve air quality including restricting driving one or two days during the weekdays. The program has had negligible results.
○
○
○
Subcategories
This category has the following 11 subcategories, out of 11 total.
A
B
C
E
G
P
T
U
Pages in category "Air Quality"
The following 56 pages are in this category, out of 56 total.
C
E
- Each of us can make a positive difference
- Earth Science
- EBikes 360
- Energy Storage - Batteries and Grid
- Environmental agreements
- Environmental full-cost accounting
- Environmental Law, Rollbacks under Trump 2016-20
- Environmental Laws and Modern Environmental Movement
- Environmental protection
- Environmental Protection Agency
- ESA Living Planet Announcement - May 2022
- European Union Green Deal - Fit for 55
- EV Corridors Electric Vehicles Zero Emission Vehicles
G
- George E. Brown Jr
- Glasgow Climate Summit - Pledges, Promises, Declarations - What's Next Up
- Going Green
- Google Earth Timelapse
- Green Best Practices
- Green New Deal
- Green Politics with GreenPolicy360
- Green Stories of the Day
- Green Stories of the Day - GreenPolicy360 Archive
- GreenPolicy360 Archive Highlights 2013
- GreenPolicy360 Archive Highlights 2014
- GreenPolicy360 Archive Highlights 2015
- GreenPolicy360 Archive Highlights 2016
- GreenPolicy360 Archive Highlights 2017
- GreenPolicy360 Archive Highlights 2018
- GreenPolicy360 Archive Highlights 2019
- GreenPolicy360 Archive Highlights 2020
- GreenPolicy360 Archive Highlights 2023
S
Media in category "Air Quality"
The following 200 files are in this category, out of 510 total.
(previous page) (next page)- 1977 from the Office of Science and Technology Policy.jpg 661 × 711; 177 KB
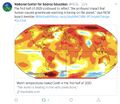
- 2020 record temperatures.png 800 × 502; 358 KB
- 7-20-2020 GreenPolicy360 RT No.2.jpg 591 × 510; 125 KB
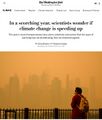
- A scorching year, what about the 360 warming data.jpg 600 × 706; 106 KB
- Acceptance on behalf of the United States of America.png 448 × 306; 62 KB
- Act now for a livable future.png 501 × 275; 272 KB
- Ag production and GHG emissions.jpg 680 × 510; 33 KB
- Air Pollution - Air Quality Nov 4, 2019 Delhi.jpg 800 × 469; 92 KB
- Air Pollution Kills, Injures, Cripples, Disables.jpg 600 × 697; 153 KB
- Air pollution moves globally.png 620 × 412; 256 KB
- Air Pollution studies of premature annual deaths.png 634 × 592; 132 KB
- Air pollution, reductions and growth - US 1970-14.png 800 × 450; 198 KB
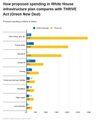
- American Jobs Act compared w THRIVE Act (Green New Deal).jpg 674 × 798; 90 KB
- Andrew Wheeler - EPA chief-coal industry lobbyist.jpg 640 × 352; 33 KB
- Andrew Wheeler confirmed to head EPA.jpg 753 × 600; 85 KB
- AOC March 26, 2019.jpg 597 × 433; 58 KB
- AOC re climate task force - july 8 2020.jpg 585 × 203; 38 KB
- AskNatureAvatar s.png 200 × 200; 14 KB
- Atmosphere Science.jpg 800 × 600; 45 KB
- Atmospheric Experiment of Humanity.jpg 519 × 574; 201 KB
- Atmotube image.png 620 × 710; 149 KB
- Banking - finance - climate - Mann-1.jpg 452 × 640; 162 KB
- Banking - finance - climate - Mann-2.jpg 452 × 640; 164 KB
- Battle for Democracy.jpg 640 × 123; 24 KB
- Bernie Sanders, Senate 2.PNG 800 × 517; 379 KB
- Bernie Sanders, Senate Aug 3.PNG 800 × 518; 388 KB
- Biden - clean energy ambitions.JPG 640 × 334; 31 KB
- Biden announces EV policies - Aug 2021.jpg 600 × 604; 112 KB
- Biden introduces leadership team - Nov 24 2020.jpg 800 × 644; 173 KB
- Biden re Earth Day 2023.png 640 × 400; 155 KB
- Biden selects Kerry as special climate envoy.jpg 592 × 505; 87 KB
- Biden urged to act - Oct 18 2021 - The Guardian.png 663 × 600; 497 KB
- Biden's assembled an all-star climate team 4-21-2021.jpg 682 × 732; 309 KB
- Biden-Sanders Unity Task Force on Climate.jpg 701 × 780; 139 KB
- Big Oil Rocked by News May 27 2021.jpg 639 × 600; 84 KB
- Big Wobble 2020.jpg 507 × 342; 79 KB
- Biggest climate related legislation in history - 1.png 800 × 188; 68 KB
- Bill Nelson on Global Temp Rise and Climate Change.png 640 × 353; 100 KB
- Bill Nye The Planet's on Fire.jpg 800 × 675; 106 KB
- Biomega-OKO 2.jpg 473 × 360; 34 KB
- Bloomberg Carbon Clock 10-26-2021 8-47-05 AM EST.png 800 × 195; 356 KB
- Bloomberg Live Climate Data Dashboard.jpg 640 × 756; 156 KB
- BMW wireless-charging.gif 640 × 356; 3.19 MB
- Bmw-i3.JPG 800 × 460; 108 KB
- BMW-Solar Charging Point.jpg 537 × 357; 54 KB
- Breakpoint - Reckoning with America's Environmental Crisis.jpg 329 × 500; 49 KB
- Burst of climate denial as Trump presidency ends.jpg 632 × 604; 92 KB
- C40 Cities actions.jpg 1,023 × 696; 174 KB
- California at the forefront of US environmental policies.png 600 × 450; 50 KB
- Car heating and cooling.png 465 × 635; 261 KB
- Carbon Brief - Greenhouse gas levels 2021.png 640 × 436; 292 KB
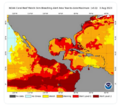
- Caribbean Sea hot - June night 2024.png 676 × 600; 386 KB
- Carl Sagan at the Emerging Issues Forum - 1990.png 360 × 460; 192 KB
- Carl Sagan at the Emerging Issues Forum.png 747 × 600; 600 KB
- Carl Sagan, the atmosphere unifies and connects all of our world.png 360 × 390; 229 KB
- Caroline Lucas-Green New Deal.jpg 584 × 391; 71 KB
- CASM Citizen Sci Air Monitor EPA.jpg 300 × 225; 59 KB
- CFSV2 world temp July 3, 2023.png 600 × 800; 513 KB
- CH4 graph - 1980-2020.JPG 640 × 446; 22 KB
- Challenge of Acting for the Commons.png 700 × 548; 175 KB
- Changes in carbon dioxide per 1000 years - via Climate Central.jpg 682 × 424; 34 KB
- Children w masks-air pollution.jpg 620 × 372; 35 KB
- Chile's electric bus fleet.jpg 543 × 541; 74 KB
- China air 2005 2014.jpg 720 × 480; 160 KB
- China Record Heat - August 2022.png 800 × 1,343; 812 KB
- Citisense.png 408 × 83; 26 KB
- Citizens Climate Lobby - Save Our Future Act 2021.jpg 518 × 262; 77 KB
- Climate Action 25th conf in Madrid.jpg 680 × 510; 22 KB
- Climate action isn't 'bunny hugging' says Boris.jpg 800 × 264; 95 KB
- Climate activist - Steven Schmidt - 1978 on.png 600 × 480; 174 KB
- Climate Books - 2020.jpg 800 × 450; 69 KB
- Climate cases on the rise - Nature, Sept 2021.png 800 × 562; 181 KB
- Climate Change COP27 - Nov 11 2022 US Representatives.jpg 712 × 444; 54 KB
- Climate Change COP27 - Nov 11 Kathy Castor.jpg 712 × 710; 77 KB
- Climate Change Laws - database collaboration.png 640 × 271; 76 KB
- Climate Change Laws of the World - database.PNG 768 × 845; 383 KB
- Climate Change Litigation Databases Climate Law.png 800 × 330; 73 KB
- Climate Change US EPA.jpg 600 × 703; 95 KB
- Climate Conferences 1979-2020.jpg 768 × 768; 121 KB
- Climate Crisis - Emily Atkin Heated No. 1.jpg 537 × 453; 61 KB
- Climate Crisis and the Global Green New Deal.jpg 293 × 418; 33 KB
- Climate debate.jpg 493 × 580; 129 KB
- Climate Desk.jpg 390 × 226; 21 KB
- Climate Emergency Institute - Oct 2022.png 610 × 600; 274 KB
- Climate Emergency Institute -- 2021.jpg 800 × 450; 55 KB
- Climate emergency.jpg 800 × 450; 69 KB
- Climate Headline News around the World - July 2023.jpg 600 × 704; 151 KB
- Climate Legacy of Biden.jpg 600 × 687; 265 KB
- Climate Models.png 639 × 558; 123 KB
- Climate News - Oct 28 2022.jpg 626 × 600; 88 KB
- Climate News - United Nations Report - Feb 2022.png 768 × 878; 539 KB
- Climate News Dec 4 2023 in Dubai.png 800 × 1,037; 649 KB
- Climate Plans Enforcement - Resources - GreenPolicy.png 768 × 897; 686 KB
- Climate poll - Florida.png 640 × 267; 36 KB
- Climate strike - Week 171.png 739 × 600; 834 KB
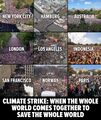
- Climate Strike Around the World - Sep20,2019.jpg 700 × 830; 119 KB
- Climate Summit - Leonardo DiCaprio.png 600 × 663; 521 KB
- Climate Summit live updates - Nov 2 2021.png 751 × 600; 420 KB
- Climate Summit planned-1.jpg 800 × 301; 53 KB
- Climate Summit planned-2.jpg 800 × 187; 31 KB
- Climate Summit planned-3.jpg 800 × 278; 44 KB
- Climate Summit planned-4.jpg 800 × 241; 41 KB
- Climate usa 60 years on.jpg 800 × 480; 34 KB
- ClimateNewsFlorida.jpg 448 × 191; 36 KB
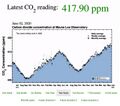
- CO2 at Mauna Loa data - June 02, 2020 - 417.90 ppm.jpg 640 × 566; 66 KB
- CO2 cumulative emissions 1850 - 2021 - countries.jpg 640 × 462; 211 KB
- CO2 emissions-around-the-world.png 800 × 595; 123 KB
- CO2 global pathways via IPCC AR6 - how will we respond.jpg 800 × 450; 57 KB
- Commons-concepts permanent culture now s.png 448 × 211; 75 KB
- Commons-concepts permanent culture now.png 830 × 391; 39 KB
- Congressman george.e.brown.gif 235 × 305; 41 KB
- COP26 Climate Summit concludes.jpg 600 × 800; 160 KB
- COP26 concludes - 2.png 648 × 467; 177 KB
- COP26 concludes - 3.png 648 × 713; 416 KB
- COP26 concludes.png 648 × 528; 329 KB
- COP26 in GLASGOW - 31 OCT-12 NOV 2021.jpg 800 × 264; 51 KB
- COP27 'opening speech'.png 640 × 460; 160 KB
- COP28 News - Dec 13 2023.png 800 × 898; 410 KB
- Coral bleaching - August 2023.png 488 × 430; 261 KB
- Coral bleaching - NOAA - August 2023.png 488 × 338; 201 KB
- Covering Climate Now.jpg 493 × 498; 67 KB
- Cradle of Civilization - and climate change.jpg 640 × 360; 70 KB
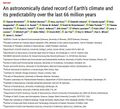
- Dated record of Earths climate - Science Report Sept 10 2020.jpg 735 × 669; 192 KB
- Defend Our Future 6-1-2020.jpg 585 × 458; 103 KB
- Democratic Climate Plan-Introduced June 2020.jpg 528 × 561; 117 KB
- Democratic National Convention-62 climate speakers.jpg 443 × 407; 57 KB
- Democratic Party pres candidates debate in Miami-June 2019.jpg 800 × 534; 124 KB
- Democratic presidential candidates on the Green New Deal.jpg 800 × 359; 57 KB
- Denying human-caused climate change.jpg 639 × 620; 129 KB
- Diesel-smoke-externalities.jpg 220 × 276; 16 KB
- DJT - US message to world.jpg 800 × 266; 45 KB
- Dove1 image.jpg 420 × 308; 26 KB
- Earth Day 2021 - Climate Summit News-1.jpg 491 × 270; 127 KB
- Earth Day 50 years on.jpg 480 × 548; 107 KB
- Earth mapped.png 800 × 783; 254 KB
- Earth Summit 1992-s.png 336 × 418; 283 KB
- Earth Summit 1992.jpg 600 × 746; 171 KB
- Earth trapping unprecedented amount of heat - NASA.jpg 468 × 373; 56 KB
- Earth-upper-atmosphere-NASA.jpg 800 × 781; 327 KB
- EarthScience Missions via the EOS - 2022.png 800 × 219; 139 KB
- Easy Motion 2016.png 800 × 266; 140 KB
- Easy Motion Evo Eco Lite l.jpg 800 × 600; 117 KB
- EBikes in California.jpg 600 × 423; 43 KB
- Economist.com global capital snapshot as of July 2020.jpg 800 × 477; 119 KB
- EDF satellite - methane tracking.png 600 × 674; 388 KB
- Electric busses-China.png 492 × 569; 277 KB
- Electric-vehicle credit Karlis Dambrans-Flickr.jpg 600 × 400; 203 KB
- Elon Musk quote - gas externality price.png 680 × 320; 199 KB
- Elon-musk-tesla-model 3.jpg 705 × 397; 32 KB
- Elon.jpg 300 × 168; 10 KB
- End of coal power in UK - 1.jpg 800 × 868; 112 KB
- End of coal power in UK - 2.png 800 × 557; 225 KB
- End of coal power in UK - 3.png 800 × 562; 240 KB
- End of Coal Power in UK.png 800 × 925; 739 KB
- Energy - Electric Measuring and Monitoring.png 715 × 1,978; 862 KB
- Energy Charter Treaty.jpg 512 × 480; 74 KB
- Env policy laws US 'the beginning' of env era.jpg 370 × 345; 65 KB
- Environmental Justice and Environmental Law.jpg 274 × 668; 108 KB
- Environmental laws in US - Supreme Court votes soon.png 800 × 414; 334 KB
- Environmental Protection Agency logo.png 380 × 414; 39 KB
- EPA and the Green Bank - Feb 2023.png 476 × 542; 244 KB
- EPA History Xin Liu-2010.pdf ; 2.88 MB
- EPA website a 'ghost page' now.png 667 × 233; 45 KB
- ERoadArlanda.png 800 × 495; 539 KB
- ESA Living Planet Symposium - Announcement.png 637 × 600; 508 KB
- ESA Living Planet Symposium - May 2022.png 700 × 600; 258 KB
- ESG Fight - Feb 2023.png 396 × 194; 88 KB
- EU agrees to cut emissions 55 percent by 2030.jpg 800 × 558; 96 KB
- EU unveils new climate change policy - July 14 2021 - 1.jpg 800 × 234; 33 KB
- EU unveils new climate change policy - July 14 2021 - 2.jpg 800 × 552; 86 KB
- EU unveils new climate change policy - July 14 2021 - 3.jpg 800 × 549; 89 KB
- EU unveils new climate change policy - July 14 2021 - 4.jpg 800 × 550; 92 KB
- EU unveils new climate change policy - July 14 2021 - 5.jpg 800 × 548; 88 KB
- EU unveils new climate change policy - July 14 2021 - 6.jpg 800 × 557; 89 KB
- EU unveils new climate change policy - July 14 2021 - 7.jpg 800 × 553; 92 KB
- EU unveils new climate change policy - July 14 2021 - 8.jpg 800 × 589; 91 KB
- Europe heat wave - July 19 2022 - via Copernicus satellite.png 600 × 639; 704 KB
- EV charging stations news, US circa Feb 2022.jpg 629 × 480; 101 KB
- EV charging stations, US circa Feb 2022.jpg 519 × 480; 78 KB
- Ev charging-station-for-plug-in-electric-cars.jpg 640 × 381; 28 KB
- EV Futures.png 702 × 461; 389 KB
- EV home charger Leviton EVB40-5PT Level 2.jpg 640 × 640; 47 KB
- EV-home charging station Leviton EVR-Green 160 - Leviton EVB-22.jpg 640 × 509; 48 KB
- EVs.png 800 × 595; 339 KB
- Extreme temperature-world-May 2024.jpg 640 × 427; 105 KB
- ExxonMobil CO2 climatic response study - Graphic 1 - 1982.png 537 × 680; 150 KB
- ExxonMobil CO2 climatic response study - Graphic 2 - 1982.png 537 × 605; 112 KB
- EZ10.png 554 × 201; 170 KB
- Fact Checking organizations at work.jpg 800 × 390; 44 KB
- Facts about US Energy Use.jpg 697 × 600; 101 KB
- Facts Count-WaPo Reports-19127 false-misleading claims in 1226 days.jpg 601 × 489; 100 KB
- Flash charging buses Geneva.png 800 × 251; 509 KB
- Ford and Tesla make EV charging deal.jpg 336 × 419; 117 KB
- Fox on Earth Day 2023.jpg 640 × 275; 58 KB
- Air Pollution
- Atmospheric Science
- California
- China
- Citizen Science
- City Governments
- City-County Governments
- Clean Air
- Climate Policy
- Environmental Full-cost Accounting
- Externalities
- Fossil Fuels
- Green Best Practices
- GreenPolicy360
- Green Politics
- Health
- India
- Planet Citizen
- Planet Scientist
- Planet Citizens, Planet Scientists
- Pollution
- UK
- US


