File:Threat Environment - TBay Times Series on Climate Change Impacts.png

Original file (556 × 864 pixels, file size: 166 KB, MIME type: image/png)
Rising Threat Project, Climate Change, Rising Seas
- Extreme Weather, Disruption, Community & Habitat Impacts
- Real Estate Losses, Life, Economic & Environmental Consequences
Are We Ready for What's Ahead of Us?
Planning for Change? Re-thinking Priorities? Acting to Address the Causes of Climate Change?
One community in Florida looks ahead and sounds a warning... Look around, don't ignore reality
~
Part 1
~
Part 2
~
Part 3
Read More at the Tampa Bay Times -- www.tampabay.com
○ ○ ○ ○ ○
About the story
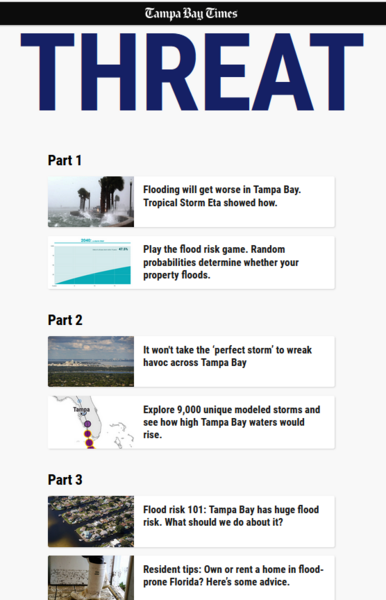
Forecasters and doomsday prognosticators have long labeled Tampa Bay among the riskiest areas in America for destruction from hurricanes.
The Tampa Bay Times wanted to determine how bad the danger is and why.
Environment reporter Zachary T. Sampson and data editor Langston Taylor spoke to more than 100 people: residents, professors, forecasters, insurance experts, scientists, lawyers and local government officials. They worked with researchers at the National Hurricane Center and with data from the University of North Carolina, Virginia Tech, Massachusetts Institute of Technology and Princeton to model storm surge under current conditions and with potential sea level rise. They compared flood maps to property records, building footprints and census records, analyzing millions of lines of data.
Determining how much rising seas will supercharge surge flooding is complicated by factors including topography, human-made construction and the physics of moving water.
The Times studied overall risk and the example of Tropical Storm Eta, which hit in early November 2020. In the first instance, reporters relied on National Hurricane Center maps, which show worst-case flooding for every spot on a map, depending on hurricane category. No single storm will cause peak flooding in every place. The maps illustrate general vulnerability.
Eta provides a case study. The model’s accuracy was spot-checked against conditions observed when the storm hit.
In some ways, these are low-end estimates for overall flooding. The modeling only looks at storm surge and does not factor in extra height delivered by waves. It also does not consider flooding from rainfall, which can lead to higher water inland.
It’s important to note these analyses have unavoidable limitations, too. Surge models are computer simulations. Reality will always be at least somewhat different. There’s no easy way to determine how high every building sits above ground, making it impossible to estimate how many homes or businesses could flood inside. But any level of water on a property could be damaging and dangerous.
The Times further took a conservative approach to estimating flood risk, measuring water at the midpoint of a building footprint rather than at a property’s edges. While assessing possible damage from Eta, reporters focused only on places where flooding could top 1 foot, the same threshold the National Hurricane Center uses to create surge advisories.
Put together, the Times’ findings reveal staggering risk.
○
File history
Click on a date/time to view the file as it appeared at that time.
| Date/Time | Thumbnail | Dimensions | User | Comment | |
|---|---|---|---|---|---|
| current | 15:03, 3 February 2022 | | 556 × 864 (166 KB) | Siterunner (talk | contribs) |
You cannot overwrite this file.
File usage
The following page uses this file:
- Sea-Level Rise & Mitigation
- Antarctica
- Arctic
- Antigua and Barbuda
- Bahamas
- Barbados
- Belize
- Cabo Verde
- Caribbean
- Climate Policy
- Comoros
- Cook Islands
- Cuba
- Dominica
- Dominican Republic
- Fiji
- Florida
- Global Security
- Greenland
- Grenada
- Guinea-Bissau
- Guyana
- Haiti
- Italy
- Kiribati
- Jamaica
- Louisiana
- Maldives
- Marshall Islands
- Micronesia
- Nauru
- New Jersey
- New Zealand
- New York
- Niue
- North Carolina
- Oceania
- Palau
- Papua New Guinea
- Samoa
- Saint Kitts and Nevis
- Saint Lucia
- Saint Vincent and the Grenadines
- Sao Tome and Principe
- Seychelles
- Small Island Developing States
- Singapore
- Solomon Islands
- South Carolina
- US
- Anthropocene
- Aquifers
- Atmospheric Science
- Building Standards
- Climate Change
- Cryosphere
- Divestment from Fossil Fuels
- Earth
- Earth360
- Earth Imaging
- Earth Observations
- Earth Science
- Earth Science from Space
- Eco-nomics
- Ecology Studies
- Environmental Full-cost Accounting
- Environmental Protection
- Environmental Security
- Environmental Security, National Security
- ESA
- Green Best Practices
- Green Graphics
- Green Politics
- Land Use
- NASA
- New Definitions of National Security
- NOAA
- Ocean Ecosystem
- Oceans
- Ocean Science
- Planet Citizens
- Planet Scientist
- Planet Citizens, Planet Scientists
- Renewable Energy
- Resilience
- Sea-level Rise
- Solar Energy
- Strategic Demands
- Sustainability
- Sustainability Policies
- US Environmental Protection Agency
- Whole Earth