Category:Air Quality
In the U.S., the election of Donald Trump in 2016 has resulted in an unprecedented assault of environmental standards and practices put together over the past half century. The costs of this deconstruction have yet to be fully calculated with a full cost accounting, but future generations will undoubtedly have harsh judgment toward policies that deliver long-term damage.
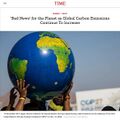
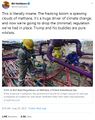
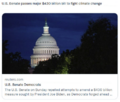
Trump's war on California's clean air standards will hurt the country
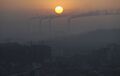
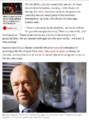
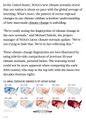
SJS / Siterunner: Years ago the smog in LA was so thick and so persistant that the city was regarded as one of the worst cases of air pollution in the world. Out of that mix of environmental disaster, and damage to a generation of kids whose lungs were affected, came the beginnings of the modern environmental movement. Los Angeles and California were at the forefront of the first set of environmental laws, incl air quality. George E Brown, a mentor and friend for over 30 yrs, was a drafter of the original EPA legis and many other key initiatives that are now at the center of green politics. George would have had strong opinions about the latest moves in the US Congress (circa 2014-2017) to move away from the roll of science and roll back the EPA, environmental protections, the responses to climate change, and the leadership role of the United States that's critically important in today's world...

- Particulate matter can cause similar adverse respiratory consequences and also trigger a range of cardiovascular problems, including heart attacks, strokes, congestive heart failure, and reduced blood supply to the heart. These problems can result in increased hospital admissions or premature death. Particulate matter can also trigger premature birth, raise the risk of autism, stunt lung development in children, and increase the risk that they develop asthma. Recent studies also implicate particulate matter in an increased risk of dementia.
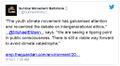
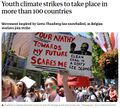
See a snapshot of the 'modern environmental movement' and first-gen environmental laws
● The first generation of Air Quality / Air Pollution laws and regulations have, over the past fifty plus years, served as a green political model in the United States and globally.
● Now, internationally, countries and cities are adopting "green best practices". Clean-up laws, regulations and technologies are improving energy, transportation, housing and key sectors of local/regional and national economies.
● Much progress remains to be planned and accomplished.
● Models for action are being shared and scientific monitoring is now being conducted worldwide.
● Global atmospheric conditions connect all nations and the work to be done is international.
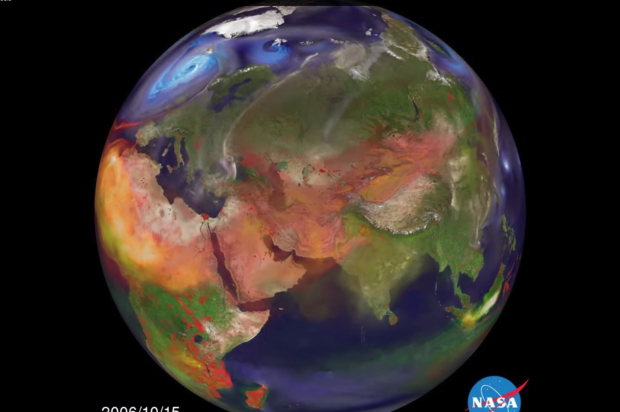
Air Quality Maps / Global
● https://www.youtube.com/watch?v=qkY5oFQD2cc
● https://www.youtube.com/watch?v=qtAd4p22NRo
● https://www.youtube.com/watch?v=1ezG7qbh784
● https://www.facebook.com/onearth.org/videos/10153613217993712/
● http://grist.org/news/terrifying-video-shows-smog-taking-over-the-earth/
● http://www.salon.com/2015/02/03/frightening_video_shows_asias_air_pollution_spread_across_earth/
···············································································································
See "Air Pollution" -- https://www.greenpolicy360.net/w/Category:Air_Pollution
Join the environmental movement, act for clean air, clean water, healthy lives, quality of living
- Even an app can change the world ...

○
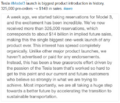
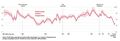
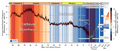
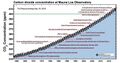
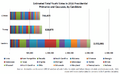
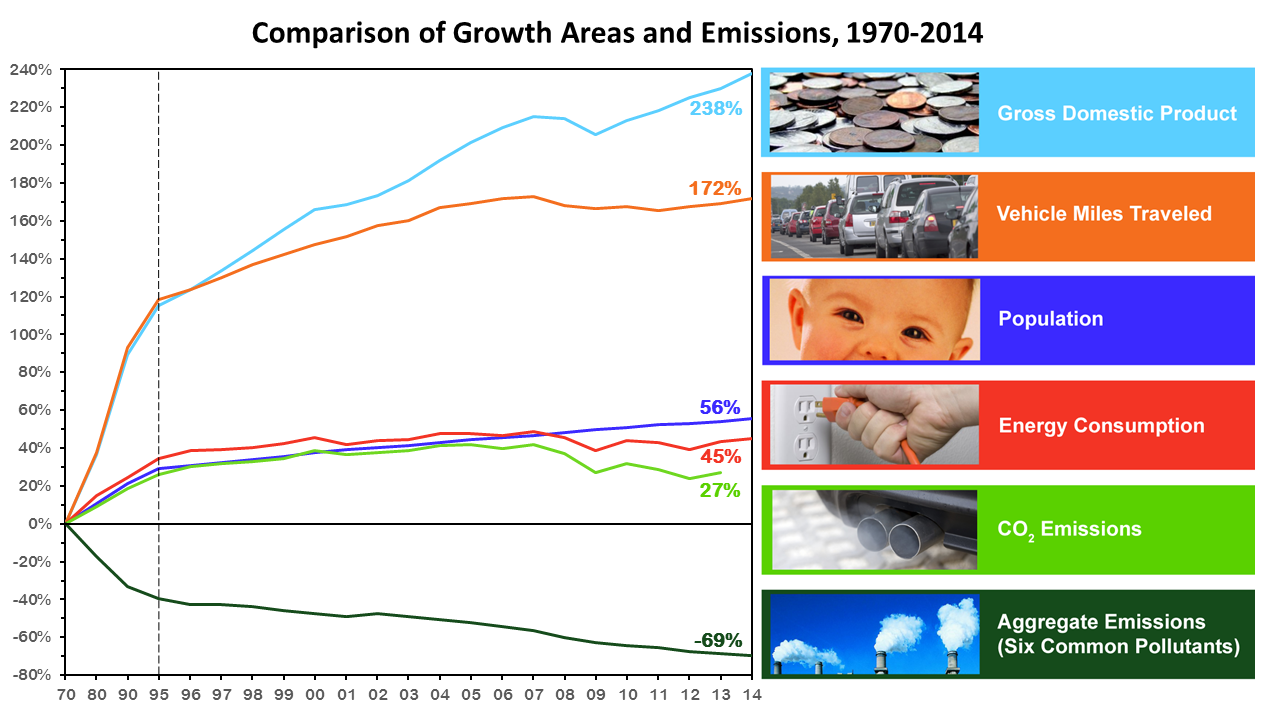
(In the US) economic health and public health haven't been locked in a zero-sum battle. The air is indisputably cleaner today, even after decades of economic growth. As the Obama administration tries to apply the Clean Air Act to a new environmental problem — climate change — it's worth wondering if past performance ever guarantees future results.
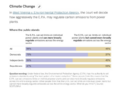
An annual report on air quality from the American Lung Association includes a revealing chart that tracks the percentage change in air pollution, gross domestic product, vehicle-miles traveled, population, energy consumption, and carbon dioxide emissions since 1970, when President Richard Nixon signed the Clean Air Act into law.
https://assets.bwbx.io/images/i7QZmZEjTodU/v1/-1x-1.png
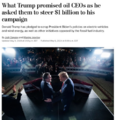
The question before the world is whether we can send climate-warming pollutants in the same direction while unlinking carbon emissions from economic growth. At the heart of the economic argument against Obama's Clean Power Plan, which uses the EPA's authority to phase out the most polluting coal plants, is that we just can't afford it. An analysis commissioned by America's Power, a group representing the coal industry, predicts that Obama's plan would cause electricity prices to spike by double digits and could cost the economy up to $39 billion a year.
"I’ve doing this over 25 years," said Paul Billings, senior vice president of advocacy for the American Lung Association. "I’ve heard this from industry every single time EPA has tried to tighten a standard."
Early evidence from carbon-cutting programs suggests that economies are not left in ruins. Nine northeastern states would have produced 24 percent more emissions if they hadn't formed the Regional Greenhouse Gas Initiative in 2009. From 2009 to 2014, their combined GDP grew by about 8 percent. British Columbia enacted a carbon tax in 2008. Emissions per capita fell 12.9 percent below its pre-tax years—3.5 times larger than the overall decline in Canadian per capita emissions—and the province has not become an economic basket case.
The EPA has studied the effects of the Clean Air Act repeatedly. A first major review came in the 1990s, when researchers found that from 1970 to 1990, cumulative benefits—which include reductions in deaths and illnesses from asthma, heart attacks, and stroke — outweighed costs by an average ranging from $22.2 trillion to $563 billion... it's possible to reduce pollution without crimping economic growth, defying doomsayers' predictions.
○
February 10th, 2017 -- One Day's Toxic Air News Pulled from the Headlines
○
https://www.sciencedaily.com/releases/2017/02/170210084550.htm
○
http://e360.yale.edu/features/origins-of-north-indias-air-pollution
○
http://www.latimes.com/science/sciencenow/la-sci-sn-air-pollution-alzheimers-20170131-story.html
○
http://www.webmd.com/diabetes/news/20170210/air-pollution-may-raise-risk-of-type-2-diabetes#1
○
https://qz.com/905656/air-pollution-is-increasing-in-africa-along-with-rapid-urbanization/
○
https://www.sciencedaily.com/releases/2017/02/170202122751.htm
Decades ago Mexico City's air pollution was so poor, birds would fall out of the sky -- dead. Locals said living there was like smoking two packs of cigarettes a day, according to one report. In response, Mexico City took several steps to try to improve air quality including restricting driving one or two days during the weekdays. The program has had negligible results.

○

○


○
Subcategories
This category has the following 11 subcategories, out of 11 total.
A
B
C
E
G
P
T
U
Pages in category "Air Quality"
The following 56 pages are in this category, out of 56 total.
C
E
- Each of us can make a positive difference
- Earth Science
- EBikes 360
- Energy Storage - Batteries and Grid
- Environmental agreements
- Environmental full-cost accounting
- Environmental Law, Rollbacks under Trump 2016-20
- Environmental Laws and Modern Environmental Movement
- Environmental protection
- Environmental Protection Agency
- ESA Living Planet Announcement - May 2022
- European Union Green Deal - Fit for 55
- EV Corridors Electric Vehicles Zero Emission Vehicles
G
- George E. Brown Jr
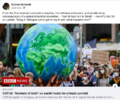
- Glasgow Climate Summit - Pledges, Promises, Declarations - What's Next Up
- Going Green
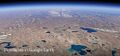
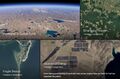
- Google Earth Timelapse
- Green Best Practices
- Green New Deal
- Green Politics with GreenPolicy360
- Green Stories of the Day
- Green Stories of the Day - GreenPolicy360 Archive
- GreenPolicy360 Archive Highlights 2013
- GreenPolicy360 Archive Highlights 2014
- GreenPolicy360 Archive Highlights 2015
- GreenPolicy360 Archive Highlights 2016
- GreenPolicy360 Archive Highlights 2017
- GreenPolicy360 Archive Highlights 2018
- GreenPolicy360 Archive Highlights 2019
- GreenPolicy360 Archive Highlights 2020
- GreenPolicy360 Archive Highlights 2023
S
Media in category "Air Quality"
The following 100 files are in this category, out of 507 total.
(previous page) (next page)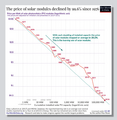 Solar panel price - 1976-2019.png 596 × 612; 92 KB
 Solar power car battery charger 2017.png 704 × 222; 96 KB
 Space stations - July 26 2022.png 544 × 462; 270 KB
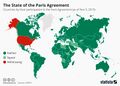 State of the paris agreement nov2019.jpg 800 × 570; 178 KB
 Statoil (Equinor ASA) headquarters in Norway.jpg 800 × 513; 75 KB
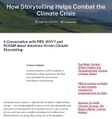
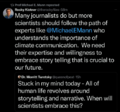 Story telling and science education.png 515 × 480; 171 KB
 StratDem Strategic Demands.png 768 × 1,024; 626 KB
 Strike - Sept 20.jpg 754 × 754; 44 KB
 Stromer ST2 2016.png 640 × 306; 118 KB
 Suburu Solterra - 2023.png 640 × 327; 541 KB
 SunriseBmore March 1, 2021.jpg 593 × 622; 187 KB
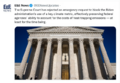 Supreme Court decision on GHG emission cost metric - May 2022.png 640 × 442; 419 KB
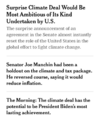 Surprise climate deal.png 589 × 735; 83 KB
 Swap n Go Battery Time.jpg 460 × 302; 42 KB
 Telling stories of solutions for the climate crisis.jpg 600 × 640; 121 KB
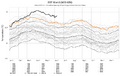 Temperature - SST World via Climate Change Institute - 2023 chart.png 800 × 509; 144 KB
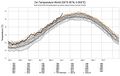 Temperature World - chart via Climate Change Institute.jpg 800 × 509; 67 KB
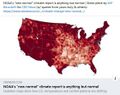 Temperatures New Normal is Not Normal.jpg 582 × 461; 56 KB
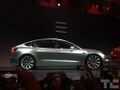 Tesla 3 Silver Apr2016.jpg 1,024 × 768; 137 KB
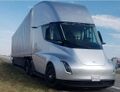 Tesla Freight Trucks - 2018.jpg 628 × 480; 50 KB
 Tesla Model3 firstwksalepre-orders.png 514 × 440; 220 KB
 Tesla production 2020.jpg 650 × 600; 56 KB
 Tesla stock up 4000 percent since IPO in 2010.jpg 684 × 143; 45 KB
 Tesla supercharged.jpg 664 × 441; 77 KB
 Tesla Tesmanian Vision circa 2020.jpg 800 × 510; 127 KB
 Tesla-gigafactory-solar-roof.jpg 662 × 433; 63 KB
 Tesla-stock-price-chart-2010-2020.jpg 640 × 465; 39 KB
 The Climate Dictionary - as of 2023.png 600 × 727; 200 KB
 The New Climate War - Irish Times review 2021.jpg 792 × 2,048; 373 KB
 They Knew.jpg 287 × 428; 31 KB
 Thin Blue difference - approx 12 miles high.jpg 527 × 229; 37 KB
 Thin Blue difference.jpg 527 × 673; 147 KB
 Time for a Planet Update - Oct 31 2021.png 722 × 600; 852 KB
 Time Nov 10 2022 COP27.jpg 600 × 600; 92 KB
 Timelapse in Google Earth -1.jpg 800 × 241; 69 KB
 Timelapse in Google Earth-2.jpg 800 × 469; 151 KB
 Timelapse in Google Earth-3.jpg 372 × 556; 52 KB
 Timelapse in Google Earth-4.jpg 525 × 244; 51 KB
 Timelapse in Google Earth-5.jpg 800 × 528; 124 KB
 Timelapse.png 800 × 566; 676 KB
 Timeline-climate-change-history-485-million years.jpg 800 × 276; 42 KB
 Tipping Points - 2020.jpg 680 × 453; 65 KB
 Toles - Dali - Climate.jpg 449 × 407; 51 KB
 Too Hot - FT.png 600 × 651; 220 KB
 Too Hot in India - Apr 2022.png 560 × 480; 120 KB
 Too Hot in US - 2.png 800 × 221; 124 KB
 Too Hot July 17 2023.png 640 × 439; 162 KB
 Too Hot US June 2022.png 695 × 543; 483 KB
 Too Hot, a new heat record - Nov 18 2023.png 788 × 680; 680 KB
 Too Hot-US-June 2021.jpg 336 × 336; 24 KB
 TOSA 2017.png 800 × 548; 173 KB
 TOSA ABB.png 800 × 359; 629 KB
 TOSA demo.png 800 × 446; 342 KB
 Toward the Hothouse.png 800 × 337; 160 KB
 Toxic sky ch.jpg 1,247 × 789; 49 KB
 Tracking Biden's Environmental Record - WaPo - Feb 2021.jpg 766 × 326; 64 KB
 Tracking Biden's Environmental Record - WaPo listing - Feb 2021.jpg 588 × 397; 35 KB
 Trump digs coal-2.jpg 800 × 533; 46 KB
 Trump envir rollbacks - clean car clean air setback.png 640 × 266; 326 KB
 Trump promise to oil ceo gathering - 1.png 440 × 108; 19 KB
 Trump promise to oil ceo gathering - 2.png 480 × 495; 291 KB
 Trump promise to oil ceo gathering - 3.png 480 × 284; 270 KB
 Trump promise to oil ceo gathering - 4.png 480 × 480; 333 KB
 Tzoa-air quality monitoring.jpg 600 × 600; 66 KB
 UN - Tipping Point for Climate Action.png 690 × 600; 601 KB
 UN Climate Summit News (1).pdf ; 1.85 MB
 UN NDC Registry - website database.png 798 × 392; 575 KB
 Unprecedented report - IPCC Aug-9-2021.jpg 800 × 666; 165 KB
 Update - James Hansen July 2023 'We are fools'.png 595 × 800; 610 KB
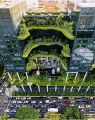 Urban Forest - Singapore Office Building.jpg 760 × 960; 129 KB
 US Annual Temperatures 1901-2020 Average Comparison.jpg 604 × 843; 242 KB
 US EPA to reverse methane rules.jpg 592 × 745; 175 KB
 US Public Law 95-367.png 732 × 469; 149 KB
 Us pv annual may2004.jpg 1,261 × 978; 187 KB
 US Quits Climate Accord.jpg 795 × 233; 40 KB
- US Role George E Brown 2.pdf ; 151 KB
- US Role George E Brown 3.pdf ; 157 KB
 US Senate passes 430 billion climate bill.png 468 × 396; 213 KB
 Usable climate science is adaptation science-Adam Sobel May 2021.jpg 702 × 664; 155 KB
 Volvo EV-Announcement-2017.png 640 × 351; 211 KB
 We are all in this together-IPCC report-August 2021.jpg 513 × 768; 183 KB
 We must flatten the curve, yes ... August 2020.jpg 800 × 421; 99 KB
 Wheeler-Mulvaney-repeal of Clean Power Plan-June19,2019.jpg 800 × 640; 145 KB
 When your house is on fire.jpg 589 × 473; 77 KB
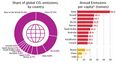 Which countries pollute the most ~2017.jpg 800 × 422; 69 KB
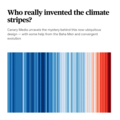 Who really invented the climate stripes - Climate Change Education.png 600 × 600; 234 KB
 Wildfires 2021 - August.jpg 519 × 220; 54 KB
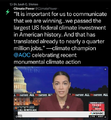 Winning on the climate legis - AOC.png 480 × 519; 249 KB
 World Map - Mercator projection v Google maps.jpg 800 × 545; 101 KB
 WV v EPA SCOTUS poll - June 27 2022 before court decision.png 623 × 480; 126 KB
 Youth Climate Movement.jpg 516 × 284; 79 KB
 Youth Climate Strikes-March15,2019.jpg 707 × 639; 159 KB
 Youth vote estimates 2016 primary.png 800 × 490; 257 KB
 Zack Labe - climate viz - June 2024.png 675 × 600; 261 KB


_headquarters_in_Norway.jpg)


