Category:Antarctica

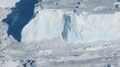
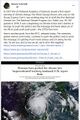
Thwaites Glacier, Antarctica

2023
October 2023
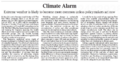
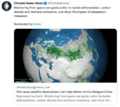
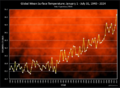
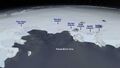
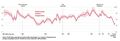
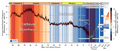
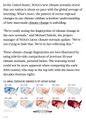
Where’s All the Antarctic Sea Ice? Annual Peak Is the Lowest Ever Recorded
National Snow and Ice Data Center
Antarctic sea ice has been growing sluggishly and staying at record lows for each month since April.
“Things got really strange,” said Walt Meier, a senior research scientist at the National Snow and Ice Data Center. “It started diverging from anything we’d seen before.”

* https://en.wikipedia.org/wiki/Antarctic_sea_ice
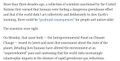
July 2023 | Antarctica's sea ice has melted so fast — and the Earth has remained so much warmer than usual — that scientists are sounding a global alarm. The reason is simple: Antarctic sea ice that always comes back after first melting has not returned. Vast regions of Antarctic coast are exposed that were never bare before.
As physical oceanographer Edward Doddridge put it, referring to this development as "unprecedented" simply "isn't strong enough. For those of you who are interested in statistics, this is a five-sigma event. So it's five standard deviations beyond the mean."
In other words: "If nothing had changed, we'd expect to see a winter like this about once every 7.5 million years."
··························································································
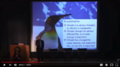
The Ice Core Story & Disruptions of the Current Era
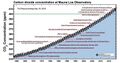
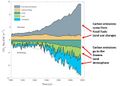
Measuring Gasses & Looking at Outgassing of CO2, Methane, & 'Business-as-Usual
Warming, Ice Melt, Interupted Water Flow & Nutrients, Ocean Life ... Connections & the Trendlines
Note the 'Rare gases', also known as the noble gases or the inert gases, a group of six gaseous elements found in small amounts in the atmosphere (and being investigated in current times as they were trapped historically in the Antarctic and are now being retrieved in deep-drilled ice cores): helium (He), neon (Ne), argon (Ar), krypton (Kr), xenon (Xe), and radon (Rn)
(Visit the recent Nature journal science study reported here below at GreenPolicy360)
Full Audio Interview
"A CLOSER VISIT WITH DR. JEFFREY SEVERINGHAUS: HOW DANGEROUS IS THE NEW ANTARCTIC ICE MELT FOR CLIMATE CHANGE?"
- "The regular supply of very cold water has been cut off..."
······································································································
Ice loss from Greenland and Antarctica hits new record
Ice loss from Greenland and Antarctica has increased fivefold since the 1990s, and now accounts for a quarter of sea-level rise.
It is without doubt that climate change is causing our polar ice sheets to melt, thereby driving up sea levels and putting coastal regions around the world at risk.
Since 1992, when satellite records of ice-sheet melt began, the polar ice sheets have lost ice every single year. The highest rates of melt have occurred in the past decade.
Scientists use data from satellites such as ESA’s CryoSat and the European Union’s Copernicus Sentinel-1 to measure changes in ice volume and flow, as well as satellites that provide information on gravity, to work out how much ice is being lost.
A team of scientists compile these records in the Ice Sheet Mass Balance Intercomparison Exercise (IMBIE), which is funded by ESA and NASA. This is used widely, including by the International Panel on Climate Change (IPCC), to understand and respond to the climate crisis.
The latest IMBIE assessment, which was published today, states that between 1992 and 2020, the polar ice sheets lost 7560 billion tonnes of ice – equivalent to an ice cube measuring 20 km each side...

🌎
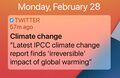
Major Study of Ice-melt Impacts Reported in the Nature Journal:
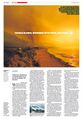
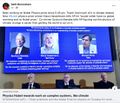
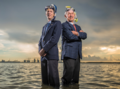
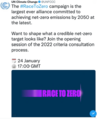
Melting Antarctic ice predicted to cause rapid slowdown of deep ocean current by 2050
New research by Australian scientists suggests 40% slowdown in just three decades could alter world’s climate for centuries
Abyssal ocean overturning slowdown and warming driven by Antarctic meltwater
Li, Q., England, M.H., Hogg, A.M. et al. Abyssal ocean overturning slowdown and warming driven by Antarctic meltwater. Nature 615, 841–847 (2023). https://doi.org/10.1038/s41586-023-05762-w
Received 20 March 2022; Accepted 25 January 2023; Published 29 March 2023
Nature Issue Date: 30 March 2023
DOI: https://doi.org/10.1038/s41586-023-05762-w | (DOI/Digital Object Identifier)
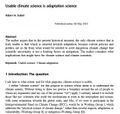
Abstract
The abyssal ocean circulation is a key component of the global meridional overturning circulation, cycling heat, carbon, oxygen and nutrients throughout the world ocean. The strongest historical trend observed in the abyssal ocean is warming at high southern latitudes, yet it is unclear what processes have driven this warming, and whether this warming is linked to a slowdown in the ocean’s overturning circulation. Furthermore, attributing change to specific drivers is difficult owing to limited measurements, and because coupled climate models exhibit biases in the region. In addition, future change remains uncertain, with the latest coordinated climate model projections not accounting for dynamic ice-sheet melt. Here we use a transient forced high-resolution coupled ocean–sea-ice model to show that under a high-emissions scenario, abyssal warming is set to accelerate over the next 30 years. We find that meltwater input around Antarctica drives a contraction of Antarctic Bottom Water (AABW), opening a pathway that allows warm Circumpolar Deep Water greater access to the continental shelf. The reduction in AABW formation results in warming and ageing of the abyssal ocean, consistent with recent measurements. In contrast, projected wind and thermal forcing has little impact on the properties, age and volume of AABW. These results highlight the critical importance of Antarctic meltwater in setting the abyssal ocean overturning, with implications for global ocean biogeochemistry and climate that could last for centuries.
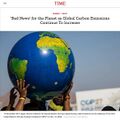
If greenhouse gas emissions continue at today’s levels, the current in the deepest parts of the ocean could slow down by 40% in only three decades.
This, the scientists said, could generate a cascade of impacts that could push up sea levels, alter weather patterns and starve marine life of a vital source of nutrients.
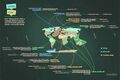
Antarctic ice melt could disrupt the world’s oceans
The Antarctic overturning circulation is part of a global network of currents that shift heat, oxygen and nutrients around the globe
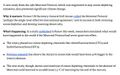
What happens in Antarctica doesn't stay in the Antarctic
Global warming is accelerating the melting of ice in Antarctica, and the increased amount of fresh water flooding into the ocean is disrupting the flow of the Antarctic overturning circulation, according to a study published in the journal Nature.
- https://www.straitstimes.com/world/antarctic-ice-melt-could-disrupt-the-world-s-oceans-study
- https://www.straitstimes.com/world/europe/monster-iceberg-released-billions-of-tonnes-of-fresh-water-into-ocean
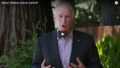
“Changes that happen in one location, such as Antarctica, can then have a global influence because those waters move all throughout the planet,” said study co-author Adele Morrison, a research fellow from the Research School of Earth Sciences at the Australian National University in Canberra.
But there are signs the overturning circulation is slowing, disrupted by the increasing amount of meltwater from Antarctica that is making the waters less salty, and therefore less dense and not sinking with the same force.
And the melting is increasing as growing amounts of greenhouse gas emissions, mainly from burning fossil fuels, are heating up the atmosphere and oceans.
“Our modelling shows that if global carbon emissions continue at the current rate, then the Antarctic overturning will slow by more than 40 per cent in the next 30 years – and on a trajectory that looks headed towards collapse,” said co-author Matthew England, deputy director of the ARC Centre for Excellence in Antarctic Science at the University of New South Wales in Sydney.
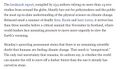
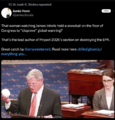
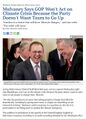
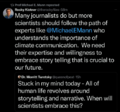
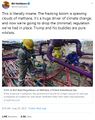
Bill McKibben, former GreenPolicy360 adviser explains:
Basically, as melting ice pours fresh water into the ocean around Antarctica, it dilutes the salinity of the sea; that reduces its density and it’s no longer heavy enough to sink, pushing out the water that’s already there. The decomposing organisms that have dropped to the sea floor thus remain locked there, as the whole vast conveyor belt begins to slow. This phenomenon has already been observed in the Arctic, where melting water pouring off Greenland and from melting sea ice has slowed the Arctic Meridional Overturning Current, or AMOC; the Australian scientists behind this new study have confirmed that the same thing is underway in the antipodes. The water that once flowed north, carrying nutrients to the Pacific, Atlantic and Indian oceans will stagnate in place."
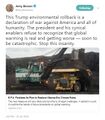
"Other studies have predicted additional problems as these currents decline, including moving rainfall bands by a thousand kilometers from their present position. As one scientist put it, the Antarctic current is “on a trajectory that looks headed towards collapse,” and not on a scale of centuries, or even century. On a scale of decades and years. We’re as far from 2050 as we are from Bill Clinton denying he’d had “sexual relations” with “that woman,” which is to say not very far (and also reminder that embarrassing presidents are not in themselves a new phenomenon, even if Trump took it to an entirely new and endlessly more dangerous level).
The scale of the systems we’re now affecting is almost incomprehensible—the flow of the Arctic current is a hundred times larger than the Amazon river. And the speed is incomprehensible. “In the past, these circulations have taken more than 1,000 years or so to change, but this is happening over just a few decades,” one of the study’s author’s said. “It’s way faster than we thought these circulations could slow down.”
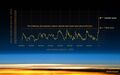
But that’s because we’ve built a new planet, one with a markedly different atmosphere. Which changes everything. Even before the epochal news from the Antarctic, the earth’s oceans had been sending distressing signals this spring. In late March, scientists reported that the temperature of ocean waters around the planet was rising abruptly, reaching record levels in recent weeks.

- 'Doomsday Glacier' Shows Its Underside (It's Breached with Terraces)
- https://www.washingtonpost.com/climate-environment/2023/02/15/glacier-ice-melt-ocean-warming/
- https://www.cnn.com/2023/02/15/world/thwaites-doomsday-glacier-sea-level-climate-intl/index.html
- https://www.nature.com/articles/s41586-022-05586-0
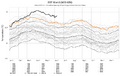
Antarctic Sea Ice Cover at Record Low
There is currently less sea ice in the Antarctic than at any time in the forty years since the beginning of satellite observation: in early February 2023, only 2.20 million square kilometres of the Southern Ocean were covered with sea ice. Researchers from the Alfred Wegener Institute and the University of Bremen analyse the situation for the Sea Ice Portal. January 2023 had already set a new record for its monthly mean extent (3.22 million square kilometres), even though the melting phase in the Southern Hemisphere continues until the end of February. The current expedition team on board RV Polarstern has just reported virtually ice-free conditions in its current research area, the Bellingshausen Sea.
2022
Antarctica Is in Trouble
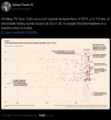
It’s 70 degrees warmer than normal in eastern Antarctica
‘This event is completely unprecedented and upended our expectations about the Antarctic climate system.’
The coldest location on the planet has experienced an episode of warm weather this week unlike any ever observed, with temperatures over the eastern Antarctic ice sheet soaring 50 to 90 degrees above normal. The warmth has smashed records and shocked scientists.
2021
Doomsday Glacier in Antarctica
"If there is going to be a climate catastrophe, it’s probably going to start at Thwaites.”
Changes in Land Ice - Antarctica - Greenland (2002-2020) - GIF
Biggest icebergs calve, drift, and crack up
World's ice melting faster than ever
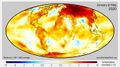
2020
Warming at more than three times the global average over the past 30 years
Study via the journal Nature Climate Change
It's all connected
The scientists said the main cause of the warming was increasing sea surface temperatures thousands of miles away in the tropics. Over the past 30 years, warming in the western tropical Pacific Ocean -- a region near the equator north of Australia and Papua New Guinea -- meant there was an increase in warm air being carried to the South Pole.
"It is wild. It is the most remote place on the planet. The significance is how extreme temperatures swing and shift over the Antarctic interior, and the mechanisms that drive them are linked 10,000 kilometers (6,200 miles) north of the continent on the tropical Pacific."
··································
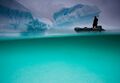
The Deepest Dive in Antarctica
- http://www.oceanx.org
- http://www.instagram.com/oceanx
- http://www.facebook.com/oceanxorg
- http://www.twitter.com/oceanx
··································
Algae in Antarctica

This summer’s Antarctic weather, as elsewhere in the world, was unprecedented in the observed record

Thwaites, Ominous and Changing as Scientists Watch
2019
What Happens in Antarctica Doesn't Stay in Antarctica
• Via National Geographic / Watching Thwaites Glacier Up Close and Personal by Elizabeth Rush
The Thwaites Glacier is often considered one of the most important when it comes to changes in sea level....
- More re: Thwaites
-- https://www.nytimes.com/2020/01/29/climate/thwaites-glacier-melting-antarctica.html
Along with Thwaites the overwhelming majority of the world’s glaciers have begun to withdraw...
Never forget: The ice is telling you what to do and not you are telling the ice what to do. Thwaites speaks, its calving a message we must now labor to hear.
Elizabeth Rush is the author of Rising: Dispatches from the New American Shore.
Scientists Detect an Enormous Cavity Growing Beneath Antarctica
- http://advances.sciencemag.org/content/5/1/eaau3433
- https://www.news.com.au/technology/environment/climate-change/thwaites-glacier-has-an-enormous-cavity-beneath-it-melted-by-warm-ocean-waters/news-story/d76c01e23593eab1d85324db89c3cd79
- Researchers say the cavity would once have been large enough to hold some 14 billion tonnes of ice. Even more disturbing, the researchers say it lost most of this ice volume over the last three years alone.
- "We have suspected for years that the Thwaites glacier was not tightly attached to the bedrock beneath it," says glaciologist Eric Rignot from the University of California, Irvine, and NASA's Jet Propulsion Laboratory (JPL) in Pasadena, California.
- "Thanks to a new generation of satellites, we can finally see the detail."
- "For global sea-level change in the next century, this Thwaites glacier is almost the entire story."
- Rignot and fellow researchers discovered the cavity using ice-penetrating radar as part of NASA's Operation IceBridge, with additional data supplied by German and French scientists.
- Antarctica is losing ice 6 times faster today than in 1980s
- Antarctic melting study... 'reasons for concern'

Read this research data thread and Antarctic sea-level rise connection from @chriscmooney, environmental reporter from the Washington Post:
- ········································································

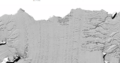
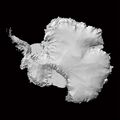
Scientists release the most accurate, high-resolution terrain map ever created (2018)
The new Antarctic map shows a resolution of 2 to 8 meters – compared to the previous standard of 1,000 meters.
Reference Elevation Model of Antarctica / Release 1
Accurate Antarctica / Phys.org
Large-format poster map of the Reference Elevation Model of Antarctica (REMA), rendered with a hillshade. Does not include any cartographic elements.
Large-format poster map of the Reference Elevation Model of Antarctica (REMA), rendered with a hillshade. Includes cartographic elements such as place name labels, graticules...
Use the links below to browse the directory for the entire REMA dataset. Refer to Documentation to see the directory structure, naming schemes, and download contents.
HTTP: http://data.pgc.umn.edu/elev/dem/setsm/REMA
FTP: ftp://ftp.data.pgc.umn.edu/elev/dem/setsm/REMA
"Considering that Antarctica is the highest, driest, and one of the most remote places on Earth, we now have an incredible topographic model to measure against in the future," said Paul Morin, a University of Minnesota earth sciences researcher and the director of the Polar Geospatial Center.
"Up until now, we've had a better map of Mars than we've had of Antarctica," said Ian Howat, professor of earth sciences and director of the Byrd Polar and Climate Research Center at The Ohio State University. "Now it is the best-mapped continent on Earth."
"It is the highest-resolution terrain map by far of any continent,’ said Ian Howat, professor of Earth sciences and director of the Byrd Polar and Climate Research Center at The Ohio State University.
- ·······································································
Antarctic Treaty System
NASA IceBridge Antarctica
Antarctica's Flowing Ice
·············································································
2018
Antarctic Melt Needs to be Monitored More Closely
What's Happening in Antarctica Won't Stay in Antarctica
East Antarctic Ice Sheet at Risk
··········
2017
Icebergs Breaking Off That Are Four Times the Size of Manhattan
How active are newly discovered Antarctic volcanoes?
A new volcanic province: an inventory of subglacial volcanoes in West Antarctica
- ...the biggest cluster of volcanoes in the world.
The study, published in the Geological Society Special Publications series, does not indicate whether the volcanoes are active but the team is trying to find out.
As Dr. Robert Bingham, a glacier expert and one of the paper's authors noted to the Guardian, "The big question is: how active are these volcanoes?"
"That is something we need to determine as quickly as possible," Bingham continued. "Anything that causes the melting of ice—which an eruption certainly would—is likely to speed up the flow of ice into the sea."
Ominously, other experts have warned that a reverse situation could also happen — volcanic activity can be triggered by thinning ice sheets from rising global temperatures.

Trillion Ton Iceberg Breaks Off
To Us It's 'Icebergia' & Away It Goes on the High Seas
As 'Icebergia' Comes Into View

- _______________________________________________________

_______________________________________________
The Future of the US Antarctica Station and Research
Climate News Now
Time to act to make a positive difference

For more news on Global Warming from GreenPolicy360, beginning with scientific data in the 1970s...
With a Special Tip of Our Green Hat to George E. Brown and his key role in launching/overseeing Earth & Atmospheric Science missions from space
~
Subcategories
This category has the following 4 subcategories, out of 4 total.
C
E
S
Pages in category "Antarctica"
The following 31 pages are in this category, out of 31 total.
C
E
G
- Glasgow Climate Summit - Pledges, Promises, Declarations - What's Next Up
- Global Climate Action Summit
- Green Stories of the Day
- Green Stories of the Day - GreenPolicy360 Archive
- GreenPolicy360 Archive Highlights 2013
- GreenPolicy360 Archive Highlights 2014
- GreenPolicy360 Archive Highlights 2015
- GreenPolicy360 Archive Highlights 2016
- GreenPolicy360 Archive Highlights 2017
- GreenPolicy360 Archive Highlights 2018
- GreenPolicy360 Archive Highlights 2019
- GreenPolicy360 Archive Highlights 2020
- GreenPolicy360 Archive Highlights 2023
S
T
Media in category "Antarctica"
The following 179 files are in this category, out of 384 total.
(previous page) (next page) IEA News 4.jpg 480 × 530; 57 KB
 IEA News 5.jpg 480 × 539; 62 KB
 Inhofe and the Snowball.png 640 × 329; 396 KB
 IPCC Report - Feb 2022.jpg 448 × 291; 113 KB
 IPCC report August 9-2021 (1).jpg 745 × 380; 156 KB
 IPCC report August 9-2021 (2).jpg 745 × 428; 171 KB
 It's Hot the Times UK Says... Act Now or else - July 2022.png 800 × 416; 568 KB
 James Hansen 2024.jpg 600 × 658; 110 KB
 James Inhofe -- and Project 2025.png 640 × 670; 566 KB
 January-May 2020 temp anomaly.jpg 680 × 380; 54 KB
 Jerry Brown re EPA - 19 June 2019.jpg 699 × 798; 126 KB
 Jerry Brown-Climate Week, NYC, Sept2018.jpg 800 × 534; 242 KB
 Jerry Brown-Global Climate Action Summit.png 800 × 453; 900 KB
 Jerry-Brown-quote.jpg 800 × 552; 69 KB
 John Kerry - Climate Envoy - 2021-09-26.png 640 × 410; 349 KB
 Journey of a Climate Pixel - May 2022.png 800 × 399; 114 KB
 June 2019 - NASA GISS data - hottest on record.jpg 640 × 560; 58 KB
 Katharine Hayhoe - Nov 26, 2019.jpg 508 × 466; 80 KB
 Lamar accuses March 2017.png 800 × 439; 245 KB
 Lamar re science and Trumps truth.png 627 × 607; 206 KB
 Lamar Smith Denial Offensive.png 393 × 307; 224 KB
 Lamar's science.png 584 × 537; 204 KB
 Launching soon.png 657 × 468; 225 KB
 LDCs face the climate crisis, raise the alarm - Nov 2021.png 419 × 226; 126 KB
 Leah Stokes - UCSB - Prof Climate and Energy Policy.png 640 × 476; 295 KB
 Like a speeding freight train.png 640 × 600; 492 KB
 LMDCs make their case at the Glasgow climate summit.png 427 × 480; 259 KB
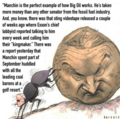
 Manchin kills the Biden climate plan.jpg 800 × 438; 71 KB
 Manchin News - Dec 20 2021.png 600 × 588; 307 KB
 Manchin News 2 - Dec 20 2021.png 600 × 600; 329 KB
 Mapping changes in global temperature 1850-2022.png 656 × 680; 180 KB
 Mascot for Glasgow intl climate conference.jpg 575 × 396; 76 KB
 Maya Lin Ghost Forest 5-17-2021.jpg 618 × 454; 123 KB
 McKibben 350.org logo.jpg 300 × 170; 7 KB
 McKibben re Manchin - Dec 2021.png 370 × 368; 261 KB
 Methane cuts pledge - COP27.png 399 × 336; 164 KB
 Methane emissions to be cut - COP26 pledges.png 640 × 464; 140 KB
 Methane Reduction proposal passes in EU Parliament - May 2023.png 620 × 600; 552 KB
 MethaneSat - 1.jpg 350 × 336; 58 KB
 MethaneSat - 2.PNG 448 × 336; 172 KB
 MethaneSat - 3.PNG 448 × 303; 248 KB
 Methods to enforce climate pledges-NDCs - Dec 2021.png 539 × 480; 333 KB
 Michael E Mann -- act with hope not fear.jpg 720 × 1,024; 122 KB
 Michael E Mann, act with hope not fear.jpg 1,246 × 1,772; 256 KB
 Michael Mann - Susan Joy Hassol after Glasgow.jpg 460 × 1,616; 299 KB
 Monitoring Greenhouse Gases from Satellite Missions 2021-2030.png 801 × 386; 143 KB
 Montreal Protocol - effects study 2021.jpg 640 × 401; 76 KB
 Moving to Higher Ground.png 568 × 473; 307 KB
 Mulvaney says no lifestyle change.jpg 561 × 779; 128 KB
 NASA co2-graph-061219.jpg 800 × 500; 214 KB
 National Climate Pledges Must Be Enforced.png 800 × 520; 122 KB
 National Climate Task Force - first mtg Feb 11 2021.jpg 591 × 654; 144 KB
 NationalGeographic SouthPole melt West Antarctica 2016.jpg 630 × 438; 89 KB
 NDC Tracker - 2020.jpg 800 × 340; 50 KB
 New Climate Model.jpg 777 × 412; 70 KB
 New Definitions of National Security.png 447 × 198; 9 KB
 New German government announces far reaching climate plans.png 632 × 600; 446 KB
 NOAA Climate.Gov.png 589 × 99; 7 KB
 NOAA extreme weather events charting.png 663 × 600; 288 KB
 NOAA undergoes political changes - Oct 2020.jpg 800 × 719; 135 KB
 Nobel Prize 2021.jpg 551 × 473; 212 KB
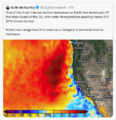 North America West Coast hot - Aug 2023.png 484 × 501; 308 KB
 Not to worry 2016.png 539 × 401; 347 KB
 NYT - Nov 1 - Day 1 headlines from Glasgow Climate Summit.png 600 × 800; 103 KB
 Oceans hottest in 2022.png 800 × 501; 358 KB
 Oct 21, 2021 - On Eve of International Climate Summit.jpg 733 × 466; 119 KB
 Oil gas climate change response plans - circa 2022.png 729 × 837; 335 KB
 Oil profits and US gas prices.png 378 × 336; 163 KB
 On the heat beat... NYT reporting-June 21 2024.png 613 × 649; 147 KB
 Our Biggest Experiment - by Alice Bell.jpg 333 × 499; 40 KB
 Our Fragile Moment.jpg 612 × 480; 80 KB
 Our Fragile Moment.png 301 × 448; 360 KB
 Paleoclimate-at the Museum of Natural History-2.png 800 × 449; 418 KB
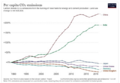 Per capita CO2 emissions - to 2020.png 640 × 442; 153 KB
 Picturing Earth from the International Space Station.jpg 800 × 470; 112 KB
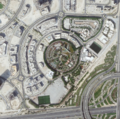 Planet Dove satellite image over Dubai.png 800 × 791; 1.58 MB
 Planet Earth temperature taking - a recent history.png 800 × 584; 618 KB
 Politics and Science in the House un-Science Committee.png 619 × 352; 198 KB
 Pope meeting with oil execs - June 2019.png 640 × 360; 589 KB
 Production Gap - productiongap.org.png 600 × 762; 225 KB
 Production Gap - UN report on fossil fuel production.png 600 × 664; 342 KB
 Race to Zero - circa January 2022.png 480 × 591; 138 KB
 RacetoZero - Dec 2020 UNFCCC.jpg 585 × 518; 95 KB
 Record tumble - climate change.png 727 × 333; 27 KB
 REMA Antarctica 9-7-2018.png 800 × 419; 377 KB
 REMA-hillshade-rendering-800px-768x768.jpg 768 × 768; 75 KB
 Republican Party 2024 Climate Strategy.png 589 × 344; 44 KB
 Rising Seas, refugees, Phys.org Land Use July 2017.png 488 × 385; 190 KB
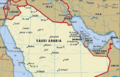 Saudi Arabia and Middle East - Hot in May 2024.png 640 × 410; 506 KB
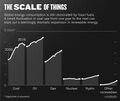 Scale of energy use-2000-2016.jpg 800 × 673; 69 KB
 School strike for climate countries.png 800 × 411; 106 KB
 Science & Solutions - 2020 - Project Drawdown - NCSE Conf.jpg 800 × 351; 56 KB
 Science & Solutions - 2020 - Project Drawdown - NCSE.jpg 800 × 261; 66 KB
 Science and Climate Hearing March29,2017.png 800 × 281; 240 KB
 SCOTUS EPA decision - June 30 2022.jpg 794 × 778; 168 KB
 Sea Wall of Miami +++.jpg 526 × 220; 48 KB
 Sea-Level Rise Twice as High as Previously Predicted.png 701 × 225; 92 KB
 Shell lawsuit Feb 2023.png 768 × 534; 229 KB
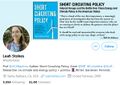 Short Circuiting Policy - by Leah Stokes.jpg 595 × 423; 94 KB
 Slash emission now or face climate disaster.jpg 800 × 579; 94 KB
 Solar panel price - 1976-2019.png 596 × 612; 92 KB
 South Florida Floodwaters.png 640 × 449; 251 KB
 SSP Baselines-projections 2018-2100.png 393 × 406; 42 KB
 State of the paris agreement nov2019.jpg 800 × 570; 178 KB
 Story telling and science education.png 515 × 480; 171 KB
 StratDem Strategic Demands.png 768 × 1,024; 626 KB
 Strike - Sept 20.jpg 754 × 754; 44 KB
 Supreme Court decision on GHG emission cost metric - May 2022.png 640 × 442; 419 KB
 Surviving Victory conf Sept20,2006.pdf ; 2.16 MB
 Telling stories of solutions for the climate crisis.jpg 600 × 640; 121 KB
 Temperature - SST World via Climate Change Institute - 2023 chart.png 800 × 509; 144 KB
 Temperature World - chart via Climate Change Institute.jpg 800 × 509; 67 KB
 Temperatures New Normal is Not Normal.jpg 582 × 461; 56 KB
 The Carbon Dioxide Theory of Climatic Change, by Gilbert Plass, 1956.jpg 798 × 1,202; 397 KB
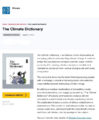 The Climate Dictionary - as of 2023.png 600 × 727; 200 KB
 The New Climate War - Irish Times review 2021.jpg 792 × 2,048; 373 KB
 There is no Planet B Macron to US Congress-Apr25,2018.png 800 × 781; 1,014 KB
 Thin Blue difference - approx 12 miles high.jpg 527 × 229; 37 KB
 Thin Blue difference.jpg 527 × 673; 147 KB
 Threat Environment - TBay Times Series on Climate Change Impacts.png 556 × 864; 166 KB
 Thwaites Glacier-2020.jpg 800 × 236; 37 KB
 Thwaites-West-Antarctica-Glaciers.jpg 800 × 450; 43 KB
 Thwaites.jpg 800 × 449; 103 KB
 Time for a Planet Update - Oct 31 2021.png 722 × 600; 852 KB
 Time Nov 10 2022 COP27.jpg 600 × 600; 92 KB
 Timeline-climate-change-history-485-million years.jpg 800 × 276; 42 KB
 Tipping Points - 2020.jpg 680 × 453; 65 KB
 Toles - Dali - Climate.jpg 449 × 407; 51 KB
 Too Hot - FT.png 600 × 651; 220 KB
 Too Hot in US - 2.png 800 × 221; 124 KB
 Too Hot July 17 2023.png 640 × 439; 162 KB
 Too Hot US June 2022.png 695 × 543; 483 KB
 Too Hot, a new heat record - Nov 18 2023.png 788 × 680; 680 KB
 Toward the Hothouse.png 800 × 337; 160 KB
 Tracking Biden's Environmental Record - WaPo - Feb 2021.jpg 766 × 326; 64 KB
 Tracking Biden's Environmental Record - WaPo listing - Feb 2021.jpg 588 × 397; 35 KB
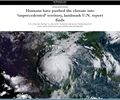
 Tropical Cyclone - Hurricane Population Displacement Risks.jpg 800 × 385; 56 KB
 Trump digs coal-2.jpg 800 × 533; 46 KB
 Trump guts climate policy 3-28-2017 10-26-34 AM.png 569 × 205; 36 KB
 Trump promise to oil ceo gathering - 1.png 440 × 108; 19 KB
 Trump promise to oil ceo gathering - 2.png 480 × 495; 291 KB
 Trump promise to oil ceo gathering - 3.png 480 × 284; 270 KB
 Trump promise to oil ceo gathering - 4.png 480 × 480; 333 KB
 UN - Tipping Point for Climate Action.png 690 × 600; 601 KB
- UN Climate Summit News (1).pdf ; 1.85 MB
 UN NDC Registry - website database.png 798 × 392; 575 KB
 Unprecedented report - IPCC Aug-9-2021.jpg 800 × 666; 165 KB
 Update - James Hansen July 2023 'We are fools'.png 595 × 800; 610 KB
 US Annual Temperatures 1901-2020 Average Comparison.jpg 604 × 843; 242 KB
 US EPA to reverse methane rules.jpg 592 × 745; 175 KB
 US Quits Climate Accord.jpg 795 × 233; 40 KB
 Usable climate science is adaptation science-Adam Sobel May 2021.jpg 702 × 664; 155 KB
 Venice flooding.png 530 × 516; 109 KB
 We are all in this together-IPCC report-August 2021.jpg 513 × 768; 183 KB
 We must flatten the curve, yes ... August 2020.jpg 800 × 421; 99 KB
 Wheeler-Mulvaney-repeal of Clean Power Plan-June19,2019.jpg 800 × 640; 145 KB
 When your house is on fire.jpg 589 × 473; 77 KB
 Where carbon emission come from - gleick tw 2018.jpg 640 × 460; 41 KB
 Which countries pollute the most ~2017.jpg 800 × 422; 69 KB
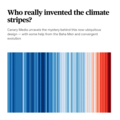 Who really invented the climate stripes - Climate Change Education.png 600 × 600; 234 KB
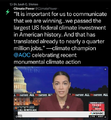 Winning on the climate legis - AOC.png 480 × 519; 249 KB
 Worlds glaciers melting faster - Nature report - Apr 2021-1.jpg 800 × 561; 94 KB
 Worlds glaciers melting faster - Nature report - Apr 2021-2.jpg 800 × 628; 108 KB
 WV v EPA SCOTUS poll - June 27 2022 before court decision.png 623 × 480; 126 KB
 Youth Climate Strikes-March15,2019.jpg 707 × 639; 159 KB
 Zack Labe - climate viz - June 2024.png 675 × 600; 261 KB


.jpg)
.jpg)


.png)


