File:Gistemp 1979-2019.png: Difference between revisions
Jump to navigation
Jump to search
Siterunner (talk | contribs) No edit summary |
Siterunner (talk | contribs) No edit summary |
||
| (9 intermediate revisions by the same user not shown) | |||
| Line 1: | Line 1: | ||
<addthis /> | <addthis /> | ||
| |||
| |||
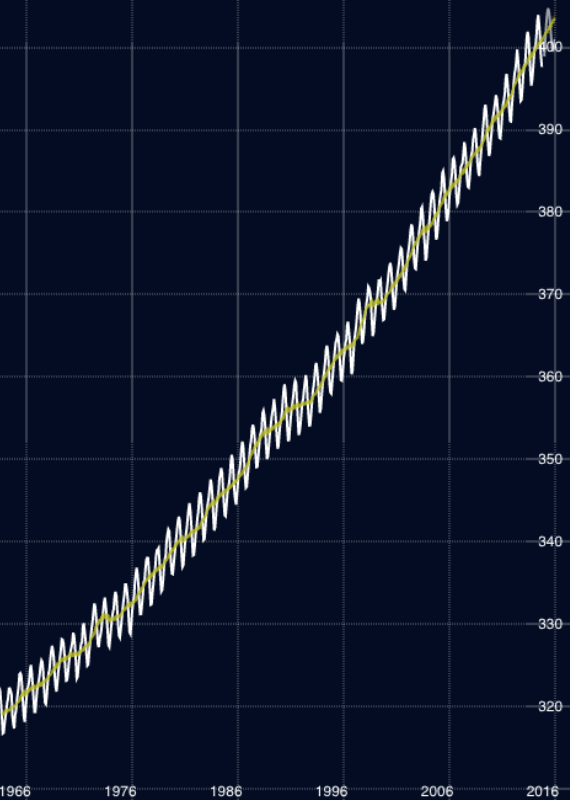
[ | ::::[[File:C02 in atmosphere chart-3.png]] | ||
| |||
• https://www.bloomberg.com/graphics/carbon-clock/ | |||
:::: [https://www.esrl.noaa.gov/gmd/ccgg/trends/monthly.html <big><big>'''February 10, 2020 / 416.08 ppm'''</big></big>] | |||
::::• https://data.giss.nasa.gov/gistemp/ | |||
::::• https://climatedataguide.ucar.edu/climate-data/global-surface-temperature-data-gistemp-nasa-goddard-institute-space-studies-giss | |||
::::• https://www.esrl.noaa.gov/gmd/ccgg/trends/monthly.html | |||
::::• https://www.bloomberg.com/graphics/carbon-clock/ | |||
:::: [https://research.noaa.gov/article/ArtMID/587/ArticleID/2455/RISING-EMISSIONS-DRIVE-GREENHOUSE-GAS-INDEX-INCREASE (NOAA) Rising Emissions / Greenhouse Gases] | |||
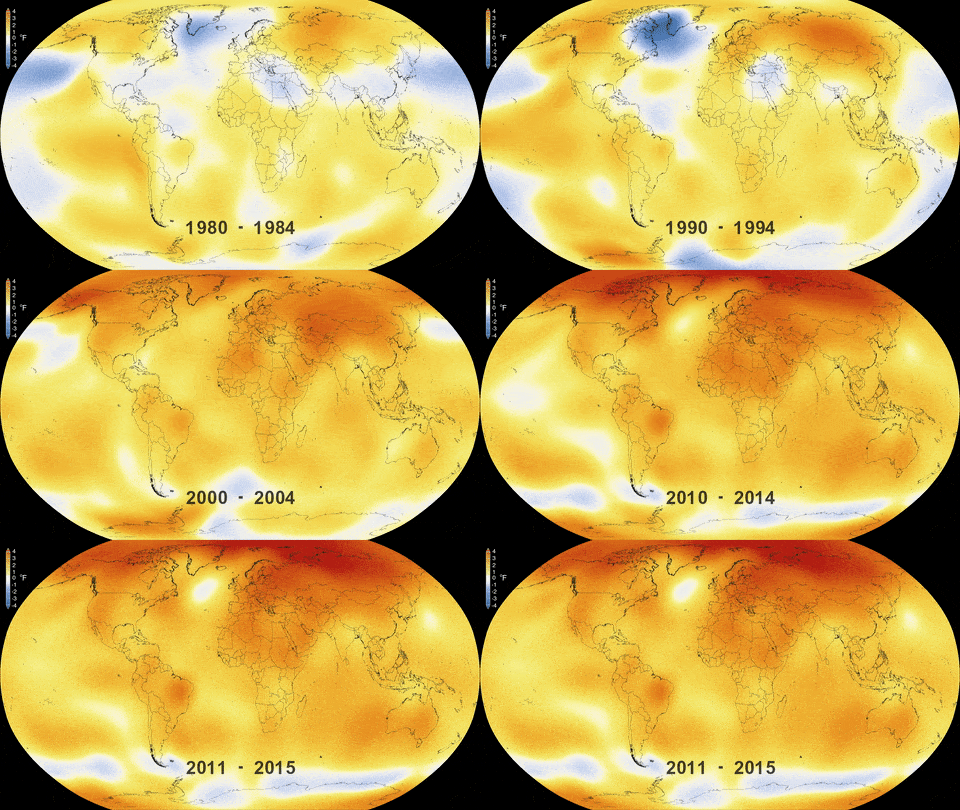
::::::[[File:Globally-averaged temps thru 2015 via NASA Goddard.gif]] | |||
○ | ○ | ||
| Line 60: | Line 78: | ||
[[Category:Global Security]] | [[Category:Global Security]] | ||
[[Category:Global Warming]] | [[Category:Global Warming]] | ||
[[Category:Green Graphics]] | |||
[[Category:Green Networking]] | [[Category:Green Networking]] | ||
[[Category:Green Politics]] | [[Category:Green Politics]] | ||
Latest revision as of 20:34, 14 February 2020
<addthis />
○
File history
Click on a date/time to view the file as it appeared at that time.
| Date/Time | Thumbnail | Dimensions | User | Comment | |
|---|---|---|---|---|---|
| current | 15:01, 14 February 2020 |  | 750 × 491 (335 KB) | Siterunner (talk | contribs) |
You cannot overwrite this file.
File usage
The following 3 pages use this file:
Categories:
- About Us
- Air Quality
- Air Pollution
- Agriculture
- Alternative Agriculture
- Antarctica
- Anthropocene
- Arctic
- Atmospheric Science
- City Governments
- Climate Change
- Climate Migration
- Climate Policy
- County Governments
- Desertification
- Digital Citizen
- Earth Imaging
- Earth Observations
- Earth360
- Earth Science
- Earth Science from Space
- Earth System Science
- Ecology Studies
- Eco-nomics
- Education
- Energy
- Environmental Laws
- Environmental Protection
- Environmental Security
- Environmental Security, National Security
- ESA
- European Union
- Externalities
- Extinction
- Florida
- Food
- Forests
- Fossil Fuels
- Greenland
- Global Security
- Global Warming
- Green Graphics
- Green Networking
- Green Politics
- Health
- INDC
- Maps
- Money in Politics
- NASA
- NOAA
- Natural Resources
- Networking
- New Definitions of National Security
- New Economy
- New Space
- Oceans
- Ocean Science
- Planet Citizen
- Planet Citizens
- Planet Citizens, Planet Scientists
- Rainforest
- Renewable Energy
- Resilience
- Sea-level Rise
- Sea-Level Rise & Mitigation
- Soil
- Solar Energy
- Strategic Demands
- Sustainability Policies
- Threat Multiplier
- United Nations
- US
- US Environmental Protection Agency
- Water Quality
- Whole Earth
- Wind Energy
- World Bank
- World Wide Web
- Youth

