Category:Water Pollution
<addthis />
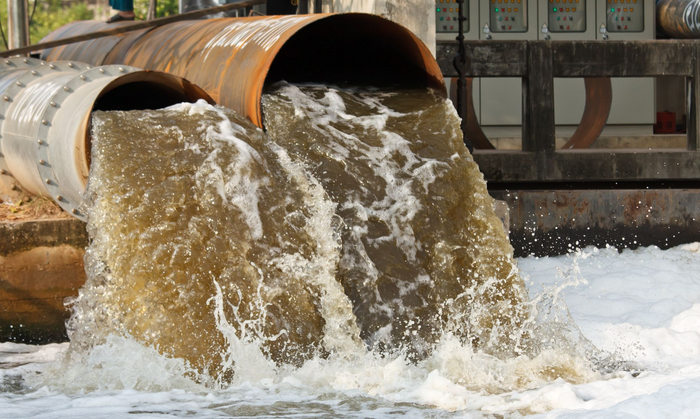
Water Pollution / Water Quality -- A Worldwide Health and Environmental Problem
An endemic global problem that requires revision of water resource policy at all levels, international down to individual aquifers and wells
Water pollution is a leading worldwide cause of deaths and diseases
- About 90 percent of the water in the cities of China is polluted (2015) ... As of 2007, half a billion Chinese had no access to safe drinking water
- In a recent national report on water quality in the United States, 45 percent of assessed stream miles, 47% of assessed lake acres, and 32 percent of assessed bays and estuarine square miles were classified as polluted ... http://www.epa.gov/waterdata/national-water-quality-inventory-report-congress
- 'Point source water pollution' (identifiable sources of contamination) and 'Nonpoint source water pollution' (sometimes referred to as 'urban runoff') must be addressed by environmental remediation/cleanup
- Surface water and groundwater contamination are increasingly evident and solutions are necessary
- The Evident Pollution -- Industrial wastewater; Agricultural runoff; Petrochemicals; Sewage/Human/Plastic/Animal Waste
- The Not-Evident Pollution -- Pathogens; Organic, inorganic and macroscopic contaminants
○
Focusing on Lead, Microscopic Lead in the Water
- Lead contaminants are exceptionally damaging when ingested by children
http://img.wennermedia.com/620-width/rs-225360-flint-city.jpg
3000+ Cities in the US Have Tested with Lead in the Water Worse than Flint, Michigan
A 2016 US investigative report suggests that recently recorded lead poisoning rates in over 3,000 areas in the U.S. were twice as high when compared to Flint, Michigan, during Flint's drinking water contamination crisis.
The Flint water crisis occurred after the city switched its water supply in 2014. In September 2015, scientific studies showed that around 4-5 percent of children screened there had high blood lead levels.
In the latest investigative report, Reuters found vulnerable neighborhoods where testing showed the highest rates of children with elevated levels of lead in their blood. By relying on data obtained from state health departments and the U.S. Centers for Disease Control and Prevention spanning about a decade, Reuters found about 1,100 communities that had rates of lead blood levels that were at least four times higher than that found in Michigan.
According to the study, pockets within cities such as Baltimore, Cleveland and Philadelphia saw an increase of 40 to 50 percent in blood lead levels in the last decade.
In all, Reuters found 2,606 census tracts, and another 278 zip code areas, with a prevalence of lead poisoning at least twice Flint’s rate. Census tracts have an average of about 4,000 residents apiece, while zip codes average populations of 7,500.
Though requests for data records were placed in all 50 states, due to lack of data or inadequate responses, the Reuters map has limitations: the available data includes roughly 61 percent of the U.S. population in 21 states.
Exposure to lead, a heavy metal neurotoxin, can cause anemia, hypertension, renal impairment, immunotoxicity and toxicity to reproductive organs. Subjection to high levels can also cause coma, convulsions and even death, according to the WHO.
-- Via Raw Story Investigation
○
Urban runoff
During warm weather, urban runoff can have significant thermal impacts on small streams, as stormwater passes over hot parking lots, roads and sidewalks. Stormwater management facilities that absorb runoff or direct it into groundwater, such as bioretention systems and infiltration basins, can reduce these thermal effects. Retention basins (ponds) tend to be less effective at reducing temperature, as the water may be heated by the sun before being discharged to a receiving stream.
The frequency and severity of harmful algal blooms (HABs) in some parts of the world have been linked to increased nutrient loading from human activities. In other areas, HABs are a predictable seasonal occurrence resulting from coastal upwelling, a natural result of the movement of certain ocean currents. The growth of marine phytoplankton (both non-toxic and toxic) is generally limited by the availability of nitrates and phosphates, which can be abundant in coastal upwelling zones as well as in agricultural run-off. The type of nitrates and phosphates available in the system are also a factor, since phytoplankton can grow at different rates depending on the relative abundance of these substances (e.g. ammonia, urea, nitrate ion). A variety of other nutrient sources can also play an important role in affecting algal bloom formation, including iron, silica or carbon. Coastal water pollution produced by humans (including iron fertilization) and systematic increase in sea water temperature have also been suggested as possible contributing factors in HABs.
Harmful algal blooms have been observed to cause adverse effects to a wide variety of aquatic organisms, most notably marine mammals, sea turtles, seabirds and finfish.
In the marine environment, single-celled, microscopic, plant-like organisms naturally occur in the well-lit surface layer of any body of water. These organisms, referred to as phytoplankton or microalgae, form the base of the food web upon which nearly all other marine organisms depend. Of the 5000+ species of marine phytoplankton that exist worldwide, about 2% are known to be harmful or toxic. Blooms of harmful algae can have large and varied impacts on marine ecosystems, depending on the species involved, the environment where they are found, and the mechanism by which they exert negative effects.
Harmful algal blooms occur in many regions of the world, and in the United States are recurring phenomena in multiple geographical regions.
○
Subcategories
This category has the following 9 subcategories, out of 9 total.
E
O
P
R
W
Pages in category "Water Pollution"
The following 13 pages are in this category, out of 13 total.
E
Media in category "Water Pollution"
The following 47 files are in this category, out of 47 total.
- 3M lawsuit re forever chemicals - June 2023.png 603 × 600; 357 KB
- About website of The Invading Sea.png 800 × 343; 126 KB
- Amherst-Bottle.gif 364 × 360; 35 KB
- Climate cases on the rise - Nature, Sept 2021.png 800 × 562; 181 KB
- Climate Change Laws - database collaboration.png 640 × 271; 76 KB
- Climate Change Laws of the World - database.PNG 768 × 845; 383 KB
- Climate Change Litigation Databases Climate Law.png 800 × 330; 73 KB
- Congressman george.e.brown.gif 235 × 305; 41 KB
- Disaster scenarios raise the stakes for Colorado River - 1.png 640 × 213; 56 KB
- Disaster scenarios raise the stakes for Colorado River - 2.png 640 × 154; 14 KB
- Dr Volts talks of lawns and their problems.jpg 492 × 376; 49 KB
- Env policy laws US 'the beginning' of env era.jpg 370 × 345; 65 KB
- Environment California - Jerry Brown quote on plastic bags.jpg 480 × 480; 45 KB
- Environmental Justice and Environmental Law.jpg 274 × 668; 108 KB
- Environmental Protection Agency logo.png 380 × 414; 39 KB
- EPA History Xin Liu-2010.pdf ; 2.88 MB
- Estuary in Clearwater on Tampa Bay.jpg 3,584 × 2,016; 1.5 MB
- EWG Tap Water Database.png 640 × 432; 59 KB
- Flooding in South Florida.png 640 × 742; 293 KB
- Florida and climate change denial.png 640 × 192; 46 KB
- George Brown, Sci Com't.jpg 200 × 200; 7 KB
- Invading Seas warning 2024.png 757 × 587; 669 KB
- OaklandWastewater plant.jpg 800 × 399; 125 KB
- Plastic Reduction agr plan.png 800 × 464; 672 KB
- SCOTUS decision on water protection.png 535 × 424; 299 KB
- Sea levels surge along southern US coast.png 640 × 441; 69 KB
- South Florida Floodwaters.png 640 × 449; 251 KB
- Tampa Bay Times Environment Hub - April 2025.jpg 769 × 768; 184 KB
- The Story of Bottled Water video.png 702 × 395; 97 KB
- US Public Law 95-367.png 732 × 469; 149 KB
- Value the Wetlands - UN Biodiversity Infographic 2023.jpg 633 × 900; 110 KB
- Water Pollution without sewage treatment.png 700 × 419; 602 KB
- Water Risk Projects.jpg 1,140 × 518; 124 KB
- Water shortage 4B people sci report-2016.png 853 × 233; 148 KB
- Water stress by country.png 2,159 × 1,115; 584 KB
- Water stress index map maplecroft.jpg 518 × 303; 123 KB


