Category:Greenland: Difference between revisions
Siterunner (talk | contribs) No edit summary |
Siterunner (talk | contribs) No edit summary |
||
| (16 intermediate revisions by the same user not shown) | |||
| Line 1: | Line 1: | ||
[[File:Greenland ice sheet set to raise sea level significantly.png]] | |||
<big>'''Green Ice Sheet Melt Is Severe -- and Sea-Level Rise Is a Reality'''</big> | |||
Via the Washington Post | |||
August 29, 2022 | |||
''Human-driven climate change has set in motion massive ice losses in Greenland that couldn’t be halted even if the world stopped emitting greenhouse gases today, according to a new study published Monday.'' | |||
''The findings in Nature Climate Change project that it is now inevitable that 3.3 percent of the Greenland ice sheet will melt — equal to 110 trillion tons of ice, the researchers said. That will trigger nearly a foot of global sea-level rise.'' | |||
''The predictions are more dire than other forecasts, though they use different assumptions. While the study did not specify a time frame for the melting and sea-level rise, the authors suggested much of it can play out between now and the year 2100.'' | |||
''“The point is, we need to plan for that ice as if it weren’t on the ice sheet in the near future, within a century or so,” William Colgan, a study co-author who studies the ice sheet from its surface with his colleagues at the Geological Survey of Denmark and Greenland...'' | |||
* https://www.washingtonpost.com/climate-environment/2022/08/29/greenland-ice-sheet-sea-level/ | |||
* https://www.nature.com/articles/s41558-022-01441-2 | |||
················································································ | |||
<big>'''''Changing in 'Human Time' '''''</big> | |||
* https://e360.yale.edu/features/in-greenlands-melting-ice-a-warning-on-hard-climate-choices | |||
<big>'''''Greenland Ice Sheet'''''</big> | <big>'''''Greenland Ice Sheet'''''</big> | ||
[https://www.greenpolicy360.net/w/File:Earth_Science_from_Space-Monitoring_Ice_Melt.jpg NASA’s ICESat and new ICESat-2 satellite laser altimetry change the way we measure and monitor ice melt and loss] | [https://www.greenpolicy360.net/w/File:Earth_Science_from_Space-Monitoring_Ice_Melt.jpg NASA’s ICESat and new ICESat-2 satellite laser altimetry change the way we measure and monitor ice melt and loss] | ||
| Line 9: | Line 37: | ||
'' | '''''Science, [https://www.greenpolicy360.net/w/File:You_can_manage_only_what_you_can_measure_Dr_David_Crisp,_OCO-2,_June_2014_m.jpg measuring and monitoring] Earth’s ice sheets, and identifying the climate drivers, is central to improving sea-level projections.''''' | ||
''Estimates of grounded and floating ice mass change from 2003 to 2019 using NASA’s ICESat and new ICESat-2 satellite laser altimetry are providing new knowledge and data as to the extent of this change over time. (Via Science)'' | |||
| Line 52: | Line 82: | ||
<font color=blue>○ ○ ○ ○ ○ ○ ○ ○ ○ ○ ○ ○ ○ ○ ○ ○ ○ ○ ○ ○ ○ ○ ○ ○ ○ ○ ○</font> | <font color=blue>○ ○ ○ ○ ○ ○ ○ ○ ○ ○ ○ ○ ○ ○ ○ ○ ○ ○ ○ ○ ○ ○ ○ ○ ○ ○ ○ ○ ○</font> | ||
'''''Fly over the Ice Sheet / Glaciers via NASA's IceBridge Mission in Greenland''''' | '''''Fly over the Ice Sheet / Glaciers via NASA's IceBridge Mission in Greenland''''' | ||
* ''https://www.facebook.com/NASAGoddard/videos/10153892374900898'' | |||
[http://m.youtube.com/watch?v=SxhLcEIWNyY ''Operation IceBridge] ... covering a vast expanse of science targets during flights over land ice, sea ice, and glaciers.... Put on your headphones, go full screen, set your monitors gear symbol HD/high definition, and enjoy a birds-eye view of a vast expanse of Greenland's mountainous regions aboard a NASA C-130.'' | |||
''For more on the mission and the science it produces, visit [http://www.nasa.gov/icebridge nasa.gov/icebridge].'' | ''For more on the mission and the science it produces, visit [http://www.nasa.gov/icebridge nasa.gov/icebridge].'' | ||
:'''''NASA Begins Final Year of Airborne Polar Ice Mission''''' | |||
:* ''https://www.youtube.com/watch?v=UZJXJ35geP8 (2019)'' | |||
:* ''https://www.youtube.com/watch?v=Kw9qIVCX488 (2018)'' | |||
:* ''https://www.youtube.com/watch?v=ftzAxM0Wxko (2017)'' | :* ''https://www.youtube.com/watch?v=ftzAxM0Wxko (2017)'' | ||
:* ''https://www.youtube.com/watch?v=Z0qVzF4KwBg (2016)'' | :* ''https://www.youtube.com/watch?v=Z0qVzF4KwBg (2016)'' | ||
:* ''https://www.youtube.com/watch?v=3L7lOBvCpKQ (2015)'' | :* ''https://www.youtube.com/watch?v=3L7lOBvCpKQ (2015)'' | ||
:* ''https://www.youtube.com/watch?v=iucS42mHn5Y (2014)'' | :* ''https://www.youtube.com/watch?v=iucS42mHn5Y (2014)'' | ||
:* ''https://www.youtube.com/watch?v=fPkLrSMbJoU (2013)'' | |||
| Line 88: | Line 122: | ||
:* ''https://int.nyt.com/data/videotape/finished/2015/10/1445868835/top-desktop-900.mp4'' | :* ''https://int.nyt.com/data/videotape/finished/2015/10/1445868835/top-desktop-900.mp4'' | ||
:* ''https://www.nasa.gov/feature/goddard/2017/nasa-flights-gauge-summer-sea-ice-melt-in-the-arctic'' | :* ''https://www.nasa.gov/feature/goddard/2017/nasa-flights-gauge-summer-sea-ice-melt-in-the-arctic'' | ||
Latest revision as of 06:44, 30 August 2022
Green Ice Sheet Melt Is Severe -- and Sea-Level Rise Is a Reality
Via the Washington Post
August 29, 2022
Human-driven climate change has set in motion massive ice losses in Greenland that couldn’t be halted even if the world stopped emitting greenhouse gases today, according to a new study published Monday.
The findings in Nature Climate Change project that it is now inevitable that 3.3 percent of the Greenland ice sheet will melt — equal to 110 trillion tons of ice, the researchers said. That will trigger nearly a foot of global sea-level rise.
The predictions are more dire than other forecasts, though they use different assumptions. While the study did not specify a time frame for the melting and sea-level rise, the authors suggested much of it can play out between now and the year 2100.
“The point is, we need to plan for that ice as if it weren’t on the ice sheet in the near future, within a century or so,” William Colgan, a study co-author who studies the ice sheet from its surface with his colleagues at the Geological Survey of Denmark and Greenland...
················································································
Changing in 'Human Time'
Greenland Ice Sheet
Science, measuring and monitoring Earth’s ice sheets, and identifying the climate drivers, is central to improving sea-level projections.
Estimates of grounded and floating ice mass change from 2003 to 2019 using NASA’s ICESat and new ICESat-2 satellite laser altimetry are providing new knowledge and data as to the extent of this change over time. (Via Science)
················································································
Melting Much Faster than Forecast: Here's Why
- By Jason E. Box
COPENHAGEN — For me it was only after eight years of studying Greenland — installing and maintaining a network of on-ice climate stations and examining how much snow evaporates from the island — that I suddenly realized glaciology textbooks needed a major revision. This was 2002. Prior to the epiphany, conventional knowledge held that the ice sheet was frozen at its bed and so the reaction time of the ice sheet to climate warming was measured in tens of thousands of years. A heck of a long time.
Climate warming had just infiltrated Greenland glaciology in earnest. Summer melt water, it turned out, drains down quickly to the bed, lubricating the glacier’s flow. Suddenly we realized an expanding melt season meant the ice sheet would be sliding faster, longer. It was not to be the only time our philosophy got hit with a major surprise that connected the ice sheet with climate change and the threat of abrupt sea level rise.
The next one came in 2006.
Somehow all marine-terminating glaciers across the southern half of Greenland doubled in speed simultaneously between 2000 and 2005. We didn’t yet know why.
In the meantime, scientists tried defining a plausible upper limit for the contribution to sea level rise from Greenland’s ice. That was at a time when surging glacier speeds — ice flow — was thought to be the dominant conveyer of ice loss, and would be for the foreseeable future. Well — surprise! — it became clear that for six years in a row, starting in 2007, ice loss from surface meltwater runoff took over the lead position in the competition for biggest loser. From 2007 to 2012, nearly each summer set higher and higher melt records, owing to persistent and unforseen weather that by 2012 would become a signature of climate change.
The competition between how much ice is lost through glacier flows into fjords versus meltwater runoff is intimately synergistic with meltwater interacting with ice flow all along the way. Increasing melt sends more water down through the ice sheet, softening the ice so it flows faster. Once at the bed the water lubricates flow. Squirting out the front of glaciers into the sea, the meltwater drives a heat exchange that undercuts glaciers, promoting calving, loss of flow resistance and faster flow. Put it this way: in Washington, D.C., to know what’s happening, you follow the money; in Greenland you follow the meltwater.
○ ○ ○ ○ ○ ○ ○ ○ ○ ○ ○ ○ ○ ○ ○ ○ ○ ○ ○ ○ ○ ○ ○ ○ ○ ○ ○ ○ ○
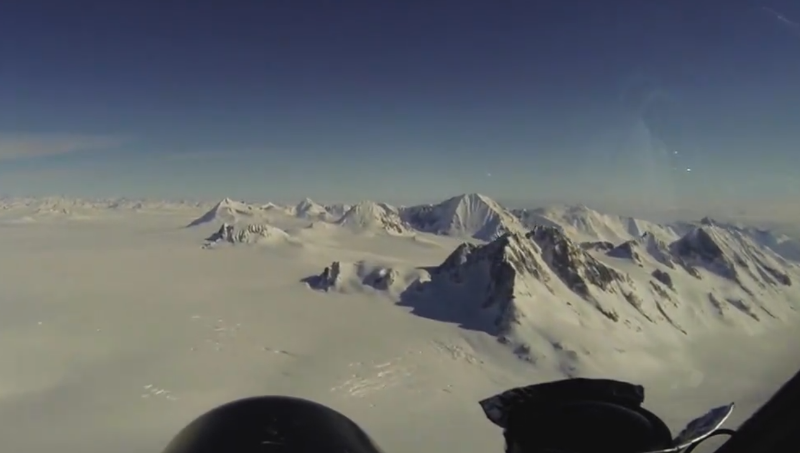
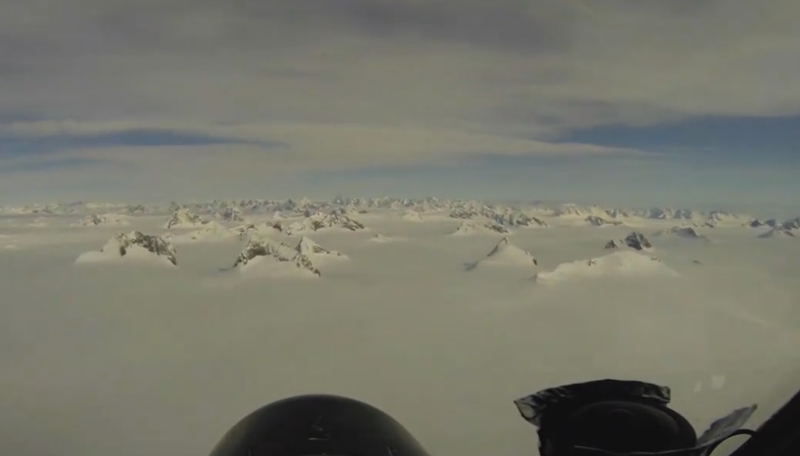
Fly over the Ice Sheet / Glaciers via NASA's IceBridge Mission in Greenland
Operation IceBridge ... covering a vast expanse of science targets during flights over land ice, sea ice, and glaciers.... Put on your headphones, go full screen, set your monitors gear symbol HD/high definition, and enjoy a birds-eye view of a vast expanse of Greenland's mountainous regions aboard a NASA C-130.
For more on the mission and the science it produces, visit nasa.gov/icebridge.
- NASA Begins Final Year of Airborne Polar Ice Mission
○ ○ ○ ○ ○ ○ ○
Watch the Melt
○
Subcategories
This category has the following 4 subcategories, out of 4 total.
A
C
E
P
Pages in category "Greenland"
The following 31 pages are in this category, out of 31 total.
C
D
E
G
- Glasgow Climate Summit - Pledges, Promises, Declarations - What's Next Up
- Green Stories of the Day
- Green Stories of the Day - GreenPolicy360 Archive
- GreenPolicy360 Archive Highlights 2013
- GreenPolicy360 Archive Highlights 2014
- GreenPolicy360 Archive Highlights 2015
- GreenPolicy360 Archive Highlights 2016
- GreenPolicy360 Archive Highlights 2017
- GreenPolicy360 Archive Highlights 2018
- GreenPolicy360 Archive Highlights 2019
- GreenPolicy360 Archive Highlights 2020
- GreenPolicy360 Archive Highlights 2023
T
Media in category "Greenland"
The following 200 files are in this category, out of 403 total.
(previous page) (next page)- 2020 record temperatures.png 800 × 502; 358 KB
- 7-20-2020 GreenPolicy360 RT No.2.jpg 591 × 510; 125 KB
- A Planet Citizen View.png 799 × 1,241; 1.64 MB
- A scorching year, what about the 360 warming data.jpg 600 × 706; 106 KB
- Acceptance on behalf of the United States of America.png 448 × 306; 62 KB
- Act now for a livable future.png 501 × 275; 272 KB
- Ag production and GHG emissions.jpg 680 × 510; 33 KB
- Against the Tide - Cover - by Cornelia Dean.jpg 308 × 475; 57 KB
- Andrew Wheeler confirmed to head EPA.jpg 753 × 600; 85 KB
- Arctic - Antarctic - Breaking.png 639 × 600; 903 KB
- Arctic - Kolbert - 2023.png 553 × 476; 274 KB
- Arctic 30.1 C at 62.5 N.jpg 800 × 432; 80 KB
- Arctic heat in Russia-Siberia 2020.gif 784 × 408; 3.6 MB
- Arctic mdl 1990-2010.jpg 720 × 667; 149 KB
- Arctic Melt - 1950-2020.png 640 × 349; 287 KB
- Arctic Sea Ice News.png 800 × 439; 458 KB
- Arctic-asia mdl 1990-2010.jpg 720 × 667; 158 KB
- Arctic-March30,2019.jpg 797 × 600; 126 KB
- Arctic-Siberia-6-20-2020.jpg 478 × 644; 148 KB
- Atmosphere Science.jpg 800 × 600; 45 KB
- Atmospheric Experiment of Humanity.jpg 519 × 574; 201 KB
- Banking - finance - climate - Mann-1.jpg 452 × 640; 162 KB
- Banking - finance - climate - Mann-2.jpg 452 × 640; 164 KB
- Battle for Democracy.jpg 640 × 123; 24 KB
- Biden introduces leadership team - Nov 24 2020.jpg 800 × 644; 173 KB
- Biden selects Kerry as special climate envoy.jpg 592 × 505; 87 KB
- Biden urged to act - Oct 18 2021 - The Guardian.png 663 × 600; 497 KB
- Biden's assembled an all-star climate team 4-21-2021.jpg 682 × 732; 309 KB
- Biden-Sanders Unity Task Force on Climate.jpg 701 × 780; 139 KB
- Big Oil Rocked by News May 27 2021.jpg 639 × 600; 84 KB
- Bill Nelson on Global Temp Rise and Climate Change.png 640 × 353; 100 KB
- Bill Nye The Planet's on Fire.jpg 800 × 675; 106 KB
- Bloomberg Carbon Clock 10-26-2021 8-47-05 AM EST.png 800 × 195; 356 KB
- Bloomberg Live Climate Data Dashboard.jpg 640 × 756; 156 KB
- Blue Marble photo taken by the crew of Apollo 17 (1972).jpg 642 × 605; 129 KB
- Breakpoint - Reckoning with America's Environmental Crisis.jpg 329 × 500; 49 KB
- Bridenstine talks.png 1,485 × 911; 223 KB
- Bucky Trimtab.jpg 348 × 336; 88 KB
- Burst of climate denial as Trump presidency ends.jpg 632 × 604; 92 KB
- Canary - 1.jpg 448 × 901; 144 KB
- Canary - 2.png 446 × 531; 264 KB
- Car heating and cooling.png 465 × 635; 261 KB
- Carbon Brief - Greenhouse gas levels 2021.png 640 × 436; 292 KB
- Caribbean Sea hot - June night 2024.png 676 × 600; 386 KB
- CFSV2 world temp July 3, 2023.png 600 × 800; 513 KB
- CH4 graph - 1980-2020.JPG 640 × 446; 22 KB
- Changes in carbon dioxide per 1000 years - via Climate Central.jpg 682 × 424; 34 KB
- Citizens Climate Lobby - Save Our Future Act 2021.jpg 518 × 262; 77 KB
- Climate Action 25th conf in Madrid.jpg 680 × 510; 22 KB
- Climate activist - Steven Schmidt - 1978 on.png 600 × 480; 174 KB
- Climate Books - 2020.jpg 800 × 450; 69 KB
- Climate Change Conf Nov 6-17.png 464 × 488; 107 KB
- Climate Change COP27 - Nov 11 2022 US Representatives.jpg 712 × 444; 54 KB
- Climate Change COP27 - Nov 11 Kathy Castor.jpg 712 × 710; 77 KB
- Climate change is not moving at a glacial pace.png 448 × 532; 217 KB
- Climate Change US EPA.jpg 600 × 703; 95 KB
- Climate Conferences 1979-2020.jpg 768 × 768; 121 KB
- Climate Crisis - Emily Atkin Heated No. 1.jpg 537 × 453; 61 KB
- Climate Crisis and the Global Green New Deal.jpg 293 × 418; 33 KB
- Climate debate.jpg 493 × 580; 129 KB
- Climate Desk.jpg 390 × 226; 21 KB
- Climate Emergency Institute - Oct 2022.png 610 × 600; 274 KB
- Climate Emergency Institute -- 2021.jpg 800 × 450; 55 KB
- Climate emergency.jpg 800 × 450; 69 KB
- Climate Headline News around the World - July 2023.jpg 600 × 704; 151 KB
- Climate Lawsuit-Our Childrens Trust-Florida.png 462 × 760; 289 KB
- Climate Models.png 639 × 558; 123 KB
- Climate News - Oct 28 2022.jpg 626 × 600; 88 KB
- Climate News - United Nations Report - Feb 2022.png 768 × 878; 539 KB
- Climate News Dec 4 2023 in Dubai.png 800 × 1,037; 649 KB
- Climate Plans Enforcement - Resources - GreenPolicy.png 768 × 897; 686 KB
- Climate Science Special Report - US - November 2017.jpg 800 × 445; 122 KB
- Climate strike - Week 171.png 739 × 600; 834 KB
- Climate Strike Around the World - Sep20,2019.jpg 700 × 830; 119 KB
- Climate Summit - Leonardo DiCaprio.png 600 × 663; 521 KB
- Climate Summit live updates - Nov 2 2021.png 751 × 600; 420 KB
- Climate Summit planned-1.jpg 800 × 301; 53 KB
- Climate Summit planned-2.jpg 800 × 187; 31 KB
- Climate Summit planned-3.jpg 800 × 278; 44 KB
- Climate Summit planned-4.jpg 800 × 241; 41 KB
- Climate usa 60 years on.jpg 800 × 480; 34 KB
- ClimateNews 360.jpg 172 × 172; 9 KB
- ClimateNewsFlorida.jpg 448 × 191; 36 KB
- CO2 at Mauna Loa data - June 02, 2020 - 417.90 ppm.jpg 640 × 566; 66 KB
- CO2 cumulative emissions 1850 - 2021 - countries.jpg 640 × 462; 211 KB
- CO2 Emissions per Capita by Country 1960-2014.png 800 × 451; 424 KB
- CO2 emissions-around-the-world.png 800 × 595; 123 KB
- CO2 global pathways via IPCC AR6 - how will we respond.jpg 800 × 450; 57 KB
- CO2 higher than in the past 5 million yrs.jpg 514 × 285; 62 KB
- COP26 Climate Summit concludes.jpg 600 × 800; 160 KB
- COP26 concludes - 2.png 648 × 467; 177 KB
- COP26 concludes - 3.png 648 × 713; 416 KB
- COP26 concludes.png 648 × 528; 329 KB
- COP26 in GLASGOW - 31 OCT-12 NOV 2021.jpg 800 × 264; 51 KB
- COP27 'opening speech'.png 640 × 460; 160 KB
- COP28 News - Dec 13 2023.png 800 × 898; 410 KB
- Coral bleaching - August 2023.png 488 × 430; 261 KB
- Coral bleaching - NOAA - August 2023.png 488 × 338; 201 KB
- Covering Climate Now.jpg 493 × 498; 67 KB
- Cradle of Civilization - and climate change.jpg 640 × 360; 70 KB
- Cumulative CO2 Emissions by Country Since 1850.png 800 × 445; 445 KB
- Dated record of Earths climate - Science Report Sept 10 2020.jpg 735 × 669; 192 KB
- Death Valley ... the heat, what its like.jpg 640 × 381; 62 KB
- Defend Our Future 6-1-2020.jpg 585 × 458; 103 KB
- Democratic Climate Plan-Introduced June 2020.jpg 528 × 561; 117 KB
- Democratic National Convention-62 climate speakers.jpg 443 × 407; 57 KB
- Democratic Party Climate Bill - Aug 2022.png 640 × 269; 70 KB
- Democratic Party pres candidates debate in Miami-June 2019.jpg 800 × 534; 124 KB
- Democratic presidential candidates on the Green New Deal.jpg 800 × 359; 57 KB
- Denying human-caused climate change.jpg 639 × 620; 129 KB
- DeSantis against climate science - 2.jpg 640 × 480; 122 KB
- DeSantis against climate science - again.jpg 460 × 640; 105 KB
- Don't Look Up ....jpg 430 × 543; 172 KB
- Don't Look Up.jpg 800 × 450; 104 KB
- Drawdown top ten solutions - 2017.png 498 × 654; 179 KB
- Earth Day 2021 - Climate Summit News-1.jpg 491 × 270; 127 KB
- Earth Day 2022 - Act up.png 457 × 370; 155 KB
- Earth Day 50 years on.jpg 480 × 548; 107 KB
- Earth Emoji.png 50 × 50; 2 KB
- Earth Science from Space-Monitoring Ice Melt.jpg 657 × 373; 60 KB
- Earth Summit 1992-s.png 336 × 418; 283 KB
- Earth Summit 1992.jpg 600 × 746; 171 KB
- Earth trapping unprecedented amount of heat - NASA.jpg 468 × 373; 56 KB
- Earth-upper-atmosphere-NASA.jpg 800 × 781; 327 KB
- Earths rotation as we roll thru space.jpg 800 × 529; 69 KB
- EarthScience Missions via the EOS - 2022.png 800 × 219; 139 KB
- Economist.com global capital snapshot as of July 2020.jpg 800 × 477; 119 KB
- EDF satellite - methane tracking.png 600 × 674; 388 KB
- Elizabeth Rush.jpg 394 × 453; 47 KB
- Elon Musk quote - gas externality price.png 680 × 320; 199 KB
- Emissions graph - gleick tw 2018.jpg 640 × 364; 37 KB
- Energy Charter Treaty.jpg 512 × 480; 74 KB
- Energy Imbalance, Climate Change - Aug 1 2021.png 640 × 672; 394 KB
- Environmental laws in US - Supreme Court votes soon.png 800 × 414; 334 KB
- EPA website a 'ghost page' now.png 667 × 233; 45 KB
- ESA Living Planet Symposium - Announcement.png 637 × 600; 508 KB
- ESA Living Planet Symposium - May 2022.png 700 × 600; 258 KB
- ESA re ice loss - April 2023.png 640 × 432; 213 KB
- ESG Fight - Feb 2023.png 396 × 194; 88 KB
- EU agrees to cut emissions 55 percent by 2030.jpg 800 × 558; 96 KB
- EU unveils new climate change policy - July 14 2021 - 1.jpg 800 × 234; 33 KB
- EU unveils new climate change policy - July 14 2021 - 2.jpg 800 × 552; 86 KB
- EU unveils new climate change policy - July 14 2021 - 3.jpg 800 × 549; 89 KB
- EU unveils new climate change policy - July 14 2021 - 4.jpg 800 × 550; 92 KB
- EU unveils new climate change policy - July 14 2021 - 5.jpg 800 × 548; 88 KB
- EU unveils new climate change policy - July 14 2021 - 6.jpg 800 × 557; 89 KB
- EU unveils new climate change policy - July 14 2021 - 7.jpg 800 × 553; 92 KB
- EU unveils new climate change policy - July 14 2021 - 8.jpg 800 × 589; 91 KB
- Europe heat wave - July 19 2022 - via Copernicus satellite.png 600 × 639; 704 KB
- Extreme temperature-world-May 2024.jpg 640 × 427; 105 KB
- ExxonMobil CO2 climatic response study - Graphic 1 - 1982.png 537 × 680; 150 KB
- ExxonMobil CO2 climatic response study - Graphic 2 - 1982.png 537 × 605; 112 KB
- Floating adaptations - GCA - for sea-level rise - circa 2023.png 600 × 732; 273 KB
- Flooding in South Florida.png 640 × 742; 293 KB
- Florida 2024 Heating up and upset.jpg 460 × 581; 89 KB
- Florida governor and legislature strike climate science - 2024.png 640 × 105; 42 KB
- From 1968 to 1992 -- and the Journey continues....png 572 × 851; 320 KB
- GCAS original.png 800 × 504; 94 KB
- GCAS-2.jpg 800 × 450; 136 KB
- GHG forcings 1750-2020.png 531 × 531; 94 KB
- GHG ppt concentrations 1975-2020.jpg 640 × 361; 69 KB
- Gistemp 1979-2019.png 750 × 491; 335 KB
- Glasgow-Climate Conference News-Nov 6, 2021.png 600 × 800; 290 KB
- Global Changes in temperature 1850-2020.jpg 480 × 480; 152 KB
- Global Climate Change textbook-Edition2.jpg 604 × 680; 96 KB
- Global climate conferences and GHG increases.jpg 793 × 801; 56 KB
- Global Climate Dashboard - NOAA - Climate.gov.png 630 × 480; 165 KB
- Global climate dashboard-NOAA climate.gov.jpg 521 × 221; 45 KB
- Global climate dashboard-www.climate.gov.jpg 800 × 489; 100 KB
- Global Climate Dashboard.jpg 800 × 529; 101 KB
- Global Climate Strike - RU.jpg 450 × 804; 116 KB
- Global fossil fuel emissions - in a lifetime graphic.png 600 × 657; 233 KB
- Global greenhouse gas emissions - 1980 - 2020.png 640 × 480; 158 KB
- Global Primary Energy Consumption - 1800-2017.jpg 800 × 583; 65 KB
- Global sea surface temperature 1982-2024.png 800 × 823; 566 KB
- Global sea surface temperature graph as of 2024.png 800 × 455; 654 KB
- Global Stocktake, the first GST.jpg 800 × 905; 513 KB
- Global temperature change 1850-2016.gif 512 × 288; 1.38 MB
- Global temperature change 1901-2000.jpg 640 × 508; 47 KB
- Global temperature variations over past 200 years.jpg 640 × 360; 29 KB
- Global warming June 2024.jpg 640 × 174; 46 KB
- GlobalClimateStrike-March15,2019.jpg 600 × 613; 30 KB
- GND next steps.png 567 × 660; 304 KB
- Google Earth Engine.png 448 × 165; 45 KB
- GP360 tagcloud2 m.png 531 × 324; 132 KB
- Green New Deal, work in progress.jpg 800 × 450; 62 KB
- Greenhouse gas levels hit record - Reuters.jpg 600 × 696; 104 KB
- Greenland ice sheet set to raise sea level significantly.png 640 × 340; 223 KB
- Greenland IceBridge 1.png 800 × 453; 0 bytes
- Greenland IceBridge 2.png 800 × 456; 318 KB
- Greenland July 2019.png 566 × 680; 299 KB
- Greenland.png 842 × 449; 402 KB
- GreenPolicy360 - May- 9-2024.png 800 × 406; 119 KB

