File:Mauna Loa CO2 - April 2022.png: Difference between revisions
Jump to navigation
Jump to search
Siterunner (talk | contribs) No edit summary |
Siterunner (talk | contribs) No edit summary |
||
| (2 intermediate revisions by the same user not shown) | |||
| Line 1: | Line 1: | ||
<addthis /> | |||
| |||
<big><big><big>'''New Record CO2 Highs, Up, Up, Up...'''</big></big></big> | <big><big><big>'''New Record CO2 Highs, Up, Up, Up...'''</big></big></big> | ||
| Line 11: | Line 12: | ||
* https://scripps.ucsd.edu/programs/keelingcurve/ | * https://scripps.ucsd.edu/programs/keelingcurve/ | ||
* https://keelingcurve.ucsd.edu/ | |||
| Line 27: | Line 28: | ||
[[File:Mauna Loa CO2 graph.png]] | :::::[[File:Mauna Loa CO2 graph.png]] | ||
🌎 | |||
Latest revision as of 17:13, 5 April 2022
<addthis />
New Record CO2 Highs, Up, Up, Up...

Mauna Loa | Keeling Curve


🌎
File history
Click on a date/time to view the file as it appeared at that time.
| Date/Time | Thumbnail | Dimensions | User | Comment | |
|---|---|---|---|---|---|
| current | 13:52, 2 April 2022 | 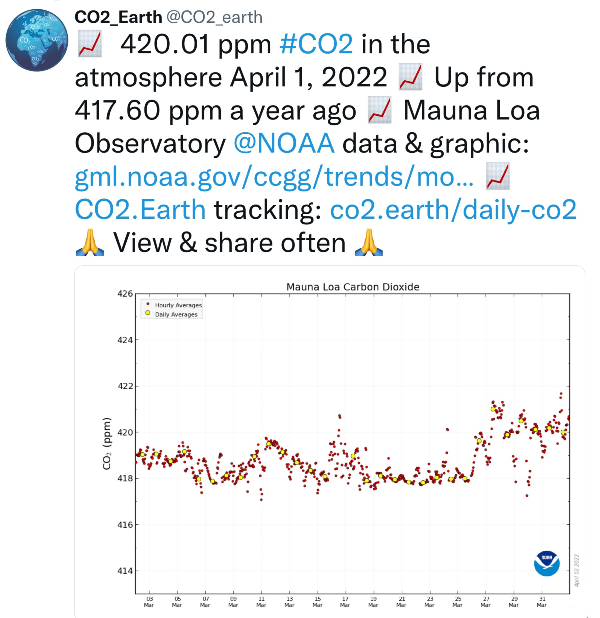 | 600 × 618 (203 KB) | Siterunner (talk | contribs) |
You cannot overwrite this file.
File usage
The following 3 pages use this file:
Categories:
- Anthropocene
- Atmospheric Science
- Climate Change
- Climate Policy
- Desertification
- Digital Citizen
- Earth Observations
- Earth360
- Earth Science
- Earth Science from Space
- Eco-nomics
- Energy
- Environmental Laws
- Environmental Protection
- Environmental Security
- Environmental Security, National Security
- Extinction
- Global Security
- Global Warming
- Green Graphics
- Green Networking
- Green Politics
- INDC
- NASA
- Natural Resources
- Networking
- Ocean Science
- Planet Citizen
- Planet Citizens
- Planet Citizens, Planet Scientists
- Renewable Energy
- Resilience
- Sea-level Rise
- Sea-Level Rise & Mitigation
- Solar Energy
- Strategic Demands
- Sustainability Policies
- US Environmental Protection Agency
- Whole Earth
- Wind Energy