Category:Soil
<addthis />
- Dirt Just Doesn't Get the Respect It Deserves
“From now until 2060, we’re going to have to produce as much food as we have in the last 500 years.”
The Soil Story by Kiss The Ground (Video)
Soil and the carbon cycle...
Climate 'Bomb' Under Your Feet
·································································
Research Study - Soil and Climate Change: Soil integrates carbon far slower than thought
“This work indicates that soils have a weaker capacity to soak up carbon than we have been assuming over the past few decades,” said UCI Chancellor’s Professor of Earth system science James Randerson, senior author of a new study on the subject to be published Friday in the journal Science. “It means we have to be even more proactive in finding ways to cut emissions of fossil fuels to limit the magnitude and impacts of climate warming.”
“A substantial amount of the greenhouse gas that we thought was being taken up and stored in the soil is actually going to stay in the atmosphere,” said study co-author Steven Allison, UCI associate professor of ecology & evolutionary biology and Earth system science.
·································································
"Dirt", the soil biology that makes agriculture possible
Don't Forget the Earthworms
Earthworms work as biological "pistons" forcing air through the tunnels as they move. Thus earthworm activity aerates and mixes the soil, and is conducive to mineralization of nutrients and their uptake by vegetation. Certain species of earthworm come to the surface and graze on the higher concentrations of organic matter present there, mixing it with the mineral soil. Because a high level of organic matter mixing is associated with soil fertility, an abundance of earthworms is generally considered beneficial by farmers and gardeners.
In fact, as long ago as 1881 Charles Darwin wrote: "It may be doubted whether there are many other animals which have played so important a part in the history of the world, as have these lowly organized creatures."
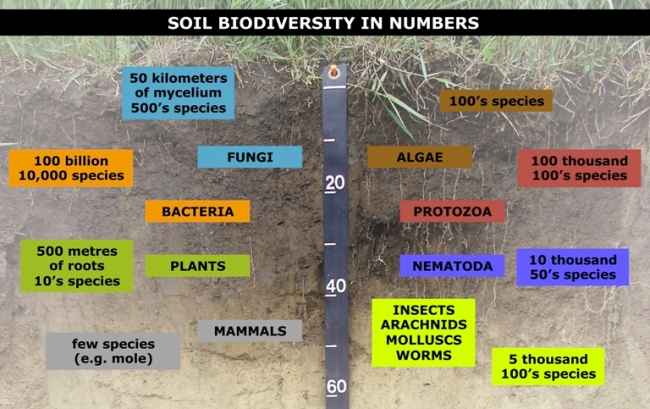
Soil biology is the study of microbial and faunal activity and ecology in soil. Soil life, soil biota, soil fauna, or edaphon is a collective term that encompasses all the organisms that spend a significant portion of their life cycle within a soil profile, or at the soil-litter interface. These organisms include earthworms, nematodes, protozoa, fungi, bacteria and different arthropods. Soil biology plays a vital role in determining many soil characteristics. The decomposition of organic matter by soil organisms has an immense influence on soil fertility, plant growth, soil structure, and carbon storage. As a relatively new science, much remains unknown about soil biology and their effects on soil ecosystems.
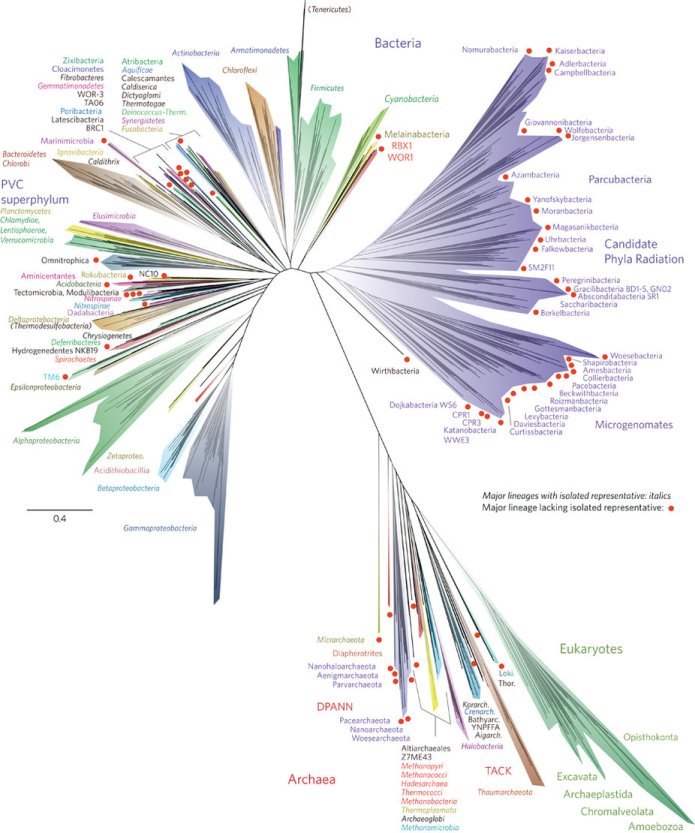
The soil is home to a large proportion of the world's biodiversity. The links between soil organisms and soil functions are observed to be incredibly complex. The interconnectedness and complexity of this soil ‘food web’ means any appraisal of soil function must necessarily take into account interactions with the living communities that exist within the soil. We know that soil organisms break down organic matter, making nutrients available for uptake by plants and other organisms. The nutrients stored in the bodies of soil organisms prevent nutrient loss by leaching. Microbial exudates act to maintain soil structure, and earthworms are important in bioturbation. However, we find that we don't understand critical aspects about how these populations function and interact. The discovery of glomalin in 1995 indicates that we lack the knowledge to correctly answer some of the most basic questions about the biogeochemical cycle in soils. We have much work ahead to gain a better understanding of how soil biological components affect us and the biosphere...
○ ○ ○ ○ ○ ○ ○ ○ ○ ○ ○ ○ ○ ○ ○
Meet Dr. Elaine Ingham -- Rodale
○ ○ ○ ○ ○ ○ ○ ○ ○ ○ ○ ○
Cover Crops: A Farming Revolution with Deep Roots in the Past / NYT - Feb 2016
The practice of seeding fields between harvests not only keeps topsoil in place, it also adds carbon to the soil and helps the beneficial microbes, fungus, bacteria and worms in it thrive...
Cover cropping is used only by a small minority of farmers. When the U.S. Agriculture Department asked for the first time about cover cropping for its 2012 Census of Agriculture report, just 10.3 million acres — out of about 390 million total acres of farmland sown in crops — on 133,124 farms were planted with cover crops. The next census won’t be done until 2017, but experts say that the practice has spread...
“We’ve never seen anything taken up as rapidly as using cover crops,” said Barry Fisher, a soil health specialist at the U.S. Natural Resources Conservation Service, an agency within the Agriculture Department.
Modern farming practices like applying fertilizer and herbicides and not tilling their fields, or “no till,” have helped farmers increase yields and reduced labor, but they have also unintentionally interfered with root systems, increased erosion and disrupted underground microbial activity and insect life that are vital to plant and soil health.
Nature Communications:
November 2015
The belowground compartment of ecosystems harbours a tremendous amount of global biodiversity.
Extinction models for belowground organisms are currently unavailable; thus, soil ecologists at the moment have no choice but to generalize the predictions for aboveground biota to their system. Yet, the ecology of belowground biota differs considerably from that of the aboveground organisms that have so far been considered in extinction models — at least with regard to their niche structure which we consider in the following. The most conspicuous difference relates to body size variability which, even without considering belowground microbes, is several orders of magnitude larger in soils. Unlike their aboveground relatives, microbial organisms in soil also represent the base trophic level of their food webs and are responsible for overall ecosystem functioning....
Habitat loss and global change
The extinction ecology for the majority of belowground organisms is thus likely to be quite different from that of the macroorganisms that have been considered so far in the literature. To gain informative insights on extinction susceptibility it is important to first compare the drivers of prospective extinctions belowground with those that have been studied so far in extinction ecology... documented drivers of extinctions are habitat loss and fragmentation.
[S]oil biota play a large role in sustainable ecosystem management.... [We need to] communicate the importance of belowground biota for ecosystem-services sustainability to aboveground extinction ecologists.
○
@GreenPolicy360
○
Soil Science Resources
SoilWeb / US - Google Earth Library
The United States Department of Agriculture Natural Resources Conservation Service has compiled detailed soils data for approximately 95 percent of the counties in the United States. The soils data contains information such as the texture, drainage, depth, and chemical characteristics of the soil. This data can be accessed by reviewing hard copy Soil Surveys (which can typically be found at the local library or local NRCS office), or online from the NRCS Web Soil Survey.
○
The 12 soil orders are listed below in the sequence in which they key out in Soil Taxonomy / see international location mapping for each
- Gelisols - soils with permafrost within 2 m of the surface
- Histosols - organic soils
- Spodosols - acid forest soils with a subsurface accumulation of metal-humus complexes
- Andisols - soils formed in volcanic ash
- Oxisols - intensely weathered soils of tropical and subtropical environments
- Vertisols - clayey soils with high shrink/swell capacity
- Aridisols - CaCO3-containing soils of arid environments with subsurface horizon development
- Ultisols - strongly leached soils with a subsurface zone of clay accumulation and <35% base saturation
- Mollisols - grassland soils with high base status
- Alfisols - moderately leached soils with a subsurface zone of clay accumulation and >35% base saturation
- Inceptisols - soils with weakly developed subsurface horizons
- Entisols - soils with little or no morphological development
○
○
Web Soil Survey (WSS) provides soil data and information produced by the National Cooperative Soil Survey. It is operated by the USDA Natural Resources Conservation Service (NRCS) and provides access to the largest natural resource information system in the world. NRCS has soil maps and data available online for more than 95 percent of the nation’s counties and anticipates having 100 percent in the near future. The site is updated and maintained online as the single authoritative source of soil survey information.
http://www.nrcs.usda.gov/wps/portal/nrcs/detail/soils/survey/geo/?cid=nrcs142p2_053619
○
Hydro-overlays
The World Hydro Reference Overlay Map service is designed to be used as a base map by scientists, professionals, and researchers in the fields of Hydrology, Geography, Climate, Soils, and other natural sciences. The map features a hydro-centric design based on the amount of water flowing within the drainage network such that symbols of the same size and color represent roughly the same amount of water.
http://www.arcgis.com/home/item.html?id=f7c73101a09c44058f8f029eefd37bd6
○
Soil Crisis Across the Globe
- "Treating Soil Like Dirt"
We’re treating soil like dirt. It’s a fatal mistake, as our lives depend on it...
by George Monbiot (*GreenPolicy360 'writer-to-follow')
Imagine a wonderful world, a planet on which there was no threat of climate breakdown, no loss of freshwater, no antibiotic resistance, no obesity crisis, no terrorism, no war. Surely, then, we would be out of major danger? Sorry. Even if everything else were miraculously fixed, we’re finished if we don’t address an issue considered so marginal and irrelevant that you can go for months without seeing it in a newspaper.
It’s literally and – it seems – metaphorically, beneath us. To judge by its absence from the media, most journalists consider it unworthy of consideration. But all human life depends on it. We knew this long ago, but somehow it has been forgotten. As a Sanskrit text written in about 1500BC noted: “Upon this handful of soil our survival depends. Husband it and it will grow our food, our fuel and our shelter and surround us with beauty. Abuse it and the soil will collapse and die, taking humanity with it.”
The issue hasn’t changed, but we have. Landowners around the world are now engaged in an orgy of soil destruction so intense that, according to the UN’s Food and Agriculture Organisation, the world on average has just 60 more years of growing crops. Even in Britain, which is spared the tropical downpours that so quickly strip exposed soil from the land, Farmers Weekly reports, we have “only 100 harvests left”.
To keep up with global food demand, the UN estimates, 6m hectares (14.8m acres) of new farmland will be needed every year. Instead, 12m hectares a year are lost through soil degradation. We wreck it, then move on, trashing rainforests and other precious habitats as we go. Soil is an almost magical substance, a living system that transforms the materials it encounters, making them available to plants. That handful the Vedic master showed his disciples contains more micro-organisms than all the people who have ever lived on Earth. Yet we treat it like, well, dirt...
○
Arable land v Non-Arable (Infertile) land
Check the arable land map for your country --
https://en.wikipedia.org/wiki/Arable_land
https://en.wikipedia.org/wiki/Soil_fertilitys
Losing the Land, Unsustainable Ag
Loss of Fertile Land Fuels ‘Looming Crisis’ Across Africa
Climate change, soil degradation and rising wealth are shrinking the amount of usable land in Africa. But the number of people who need it is rising fast
○
Only Decades of Farming If Soil Degradation Continues
Generating three centimeters of top soil takes 1,000 years, and if current rates of degradation continue all of the world's top soil could be gone within 60 years...
About a third of the world's soil has already been degraded, Maria-Helena Semedo of the Food and Agriculture Organization (FAO) told a forum marking World Soil Day.
The causes of soil destruction include chemical-heavy farming techniques, deforestation which increases erosion, and global warming. The earth under our feet is too often ignored by policymakers, experts say.
Unless new approaches are adopted, the global amount of arable and productive land per person in 2050 will be only a quarter of the level in 1960, the FAO reported, due to growing populations and soil degradation...
Soils play a key role in absorbing carbon and filtering water, the FAO reported. Soil destruction creates a vicious cycle, in which less carbon is stored, the world gets hotter, and the land is further degraded.
"We are losing 30 soccer fields of soil every minute, mostly due to intensive farming," Volkert Engelsman, an activist with the International Federation of Organic Agriculture Movements told the forum at the FAO's headquarters in Rome.
"Organic (farming) may not be the only solution but it's the single best (option) I can think of."
○
"Think of soil as an organism"
A broken food system is destroying the soil and fueling health crises as well as conflicts, warns Professor John Crawford of the University of Sydney.
Watch Professor John Crawford / Sustainability and Complex Systems Director --
○
Microbiomes
○
"Soil Depletion"
https://agenda.weforum.org/2012/12/what-if-soil-runs-out/
http://world.time.com/2012/12/14/what-if-the-worlds-soil-runs-out/
Q&A with Professor Crawford
Is soil really in danger of running out?
A rough calculation of current rates of soil degradation suggests we have about 60 years of topsoil left. Some 40% of soil used for agriculture around the world is classed as either degraded or seriously degraded – the latter means that 70% of the topsoil, the layer allowing plants to grow, is gone. Because of various farming methods that strip the soil of carbon and make it less robust as well as weaker in nutrients, soil is being lost at between 10 and 40 times the rate at which it can be naturally replenished. Even the well-maintained farming land in Europe, which may look idyllic, is being lost at unsustainable rates...
Agriculture accounts for 70% of our fresh water use: we pour most of our water straight onto the ground. If soil is not fit for purpose, that water will be wasted, because it washes right through degraded soil and past the root system. Given the enormous potential for conflict over water in the next 20-30 years, you don’t want to exacerbate things by continuing to damage the soil, which is exactly what’s happening now.
How does soil erosion happen?
Soil is a living material: if you hold a handful of soil, there will be more microorganisms in there than the number of people who have ever lived on the planet. These microbes recycle organic material, which underpins the cycle of life on Earth, and also engineer the soil on a tiny level to make it more resilient and better at holding onto water. Microbes need carbon for food, but carbon is being lost from the soil in a number of ways.
Simply put, we take too much from the soil and don’t put enough back. Whereas the classic approach would have been to leave stubble in the field after harvest, this is now often being burned off, which can make it easier to grow the next crop; or it’s being removed and used for animal feed. Second, carbon is lost by too much disturbance of the soil by over-ploughing and by the misuse of certain fertilizers. And the third problem is overgrazing. If there are too many animals, they eat all the plant growth, and one of the most important ways of getting carbon into the soil is through photosynthesis.
What happens if this isn’t addressed?
There are two key issues. One is the loss of soil productivity. Under a business-as-usual scenario, degraded soil will mean that we will produce 30% less food over the next 20-50 years. This is against a background of projected demand requiring us to grow 50% more food, as the population grows and wealthier people in countries like China and India eat more meat, which takes more land to produce weight-for-weight than, say, rice.
Second, water will reach a crisis point. This issue is already causing conflicts in India, China, Pakistan and the Middle East. Before climate change and food security really hit, the next wars are likely to be fought over unsustainable irrigation. Even moderately degraded soil will hold less than half of the water held by healthy soil in the same location. If you’re irrigating a crop, you need water to stay in the soil close to the plant roots. However, a staggering paper was published recently indicating that nearly half of the sea level rise since 1960 is due to irrigation water flowing straight past the crops and washing out to sea.
Who will be impacted the most?
Soil erosion is most serious in China, Africa, India and parts of South America. If the food supply goes down, then, obviously, the price goes up. The crisis points will hit the poorest countries hardest...
○
Soil and Water: An Overview of the US
- The US Southwest Has Serious Water-Soil Problems -- and the Ogallala Is in Danger
- http://research.msu.edu/tag/ogallala-aquifer/
- http://research.msu.edu/saving-the-great-plains-water-supply-2/
- Large areas of the Ogallala Aquifer, one of the most important sources of water for agricultural crops in the United States, are at risk of drying up if the aquifer continues to be drained at its current rate.
- The Ogallala, also known as the High Plains Aquifer (HPA), spans from Texas to South Dakota and provides water to grow $35 billion in crops each year. However, since the 1950s, when high-volume pumping began, the HPA’s saturated volume has declined by roughly the volume of Lake Erie...
○
According to the U.S. Geological Survey, water levels across most of the Ogallala have fallen at least five feet since farmers began irrigating the Great Plains in the 1940s. Almost one-fifth of the area has dropped at least 25 feet, while 11% has lost 50 feet or more.
○
Aquifer Depletion, Drought -- Soil, Organic Impacts and Loss
http://www.greenpolicy360.net/w/Aquifers
Aquifer depletion worldwide mapping
Depletion & Runoff Pollution
○
Subcategories
This category has the following 7 subcategories, out of 7 total.
Pages in category "Soil"
The following 46 pages are in this category, out of 46 total.
C
E
P
T
Media in category "Soil"
The following 200 files are in this category, out of 433 total.
(previous page) (next page)- 2020 record temperatures.png 800 × 502; 358 KB
- 3M lawsuit re forever chemicals - June 2023.png 603 × 600; 357 KB
- 7-20-2020 GreenPolicy360 RT No.2.jpg 591 × 510; 125 KB
- A land ethic .jpg 864 × 668; 79 KB
- A root and its mycorrhizal fungus surroundings.PNG 315 × 382; 236 KB
- A scorching year, what about the 360 warming data.jpg 600 × 706; 106 KB
- AB 2480 Meadows and Forest Water Infrastructure.png 481 × 375; 248 KB
- Acceptance on behalf of the United States of America.png 448 × 306; 62 KB
- Act now for a livable future.png 501 × 275; 272 KB
- Ag production and GHG emissions.jpg 680 × 510; 33 KB
- Agriculture and seeds.jpg 1,920 × 1,080; 1.16 MB
- All species day with homo sapien in Santa Fe .jpg 640 × 369; 98 KB
- Amazon fires burn across the rainforest.jpg 800 × 504; 76 KB
- Anthropocene bks016.png 800 × 248; 227 KB
- Anthropocene-crutzen.jpg 628 × 347; 79 KB
- Anthropocene-the-geology-of-humanity.jpg 628 × 347; 79 KB
- AOC re climate task force - july 8 2020.jpg 585 × 203; 38 KB
- Apple varietals.jpg 600 × 314; 30 KB
- Arable land percent world.png 1,357 × 628; 40 KB
- ArcGIS-logo.png 302 × 167; 7 KB
- AskNatureAvatar s.png 200 × 200; 14 KB
- At st peters endangered species.png 717 × 431; 242 KB
- Atmosphere Science.jpg 800 × 600; 45 KB
- Audubon study ms.png 529 × 434; 437 KB
- Banking - finance - climate - Mann-1.jpg 452 × 640; 162 KB
- Banking - finance - climate - Mann-2.jpg 452 × 640; 164 KB
- Biden - clean energy ambitions.JPG 640 × 334; 31 KB
- Biden introduces leadership team - Nov 24 2020.jpg 800 × 644; 173 KB
- Biden re Earth Day 2023.png 640 × 400; 155 KB
- Biden selects Kerry as special climate envoy.jpg 592 × 505; 87 KB
- Biden urged to act - Oct 18 2021 - The Guardian.png 663 × 600; 497 KB
- Biden's assembled an all-star climate team 4-21-2021.jpg 682 × 732; 309 KB
- Biden-Sanders Unity Task Force on Climate.jpg 701 × 780; 139 KB
- Big Oil Rocked by News May 27 2021.jpg 639 × 600; 84 KB
- Bill Mollison 1928-2016.pdf ; 99 KB
- Bill Mollison courtesy of Permaculture magazine.jpg 460 × 300; 0 bytes
- Bill Mollison quotes.png 524 × 205; 274 KB
- Bill Mollison the day after his passing memories.png 1,381 × 651; 1.65 MB
- Bill Nelson on Global Temp Rise and Climate Change.png 640 × 353; 100 KB
- Bill Nye The Planet's on Fire.jpg 800 × 675; 106 KB
- Biodiversity-by-dreamchaotic.jpg 600 × 173; 66 KB
- Bioneers 2023 - ThirdAct.Org.jpg 624 × 600; 145 KB
- Bloomberg Carbon Clock 10-26-2021 8-47-05 AM EST.png 800 × 195; 356 KB
- Bloomberg Live Climate Data Dashboard.jpg 640 × 756; 156 KB
- Breakpoint - Reckoning with America's Environmental Crisis.jpg 329 × 500; 49 KB
- Burst of climate denial as Trump presidency ends.jpg 632 × 604; 92 KB
- California's Central Valley Earth View June 2015.png 1,571 × 767; 0 bytes
- Car heating and cooling.png 465 × 635; 261 KB
- Carbon Brief - Greenhouse gas levels 2021.png 640 × 436; 292 KB
- CarbonQuote Dr Rattan Lal.jpg 600 × 600; 542 KB
- Caribbean Sea hot - June night 2024.png 676 × 600; 386 KB
- Carl Sagan at the Emerging Issues Forum - 1990.png 360 × 460; 192 KB
- Carl Sagan at the Emerging Issues Forum.png 747 × 600; 600 KB
- Carl Sagan, 1985.PNG 480 × 566; 331 KB
- Carl Sagan, the atmosphere unifies and connects all of our world.png 360 × 390; 229 KB
- Celebrating 50 Years of Landsat.png 600 × 610; 909 KB
- Cellular Landscape.jpg 300 × 336; 44 KB
- CFSV2 world temp July 3, 2023.png 600 × 800; 513 KB
- CH4 graph - 1980-2020.JPG 640 × 446; 22 KB
- Changes in carbon dioxide per 1000 years - via Climate Central.jpg 682 × 424; 34 KB
- China Record Heat - August 2022.png 800 × 1,343; 812 KB
- Cisterns rebateprogram.jpg 628 × 390; 355 KB
- Climate Action 25th conf in Madrid.jpg 680 × 510; 22 KB
- Climate activist - Steven Schmidt - 1978 on.png 600 × 480; 174 KB
- Climate Books - 2020.jpg 800 × 450; 69 KB
- Climate Change COP27 - Nov 11 2022 US Representatives.jpg 712 × 444; 54 KB
- Climate Change COP27 - Nov 11 Kathy Castor.jpg 712 × 710; 77 KB
- Climate Change US EPA.jpg 600 × 703; 95 KB
- Climate Conferences 1979-2020.jpg 768 × 768; 121 KB
- Climate Crisis - Emily Atkin Heated No. 1.jpg 537 × 453; 61 KB
- Climate Crisis and the Global Green New Deal.jpg 293 × 418; 33 KB
- Climate debate.jpg 493 × 580; 129 KB
- Climate Desk.jpg 390 × 226; 21 KB
- Climate Emergency Institute - Oct 2022.png 610 × 600; 274 KB
- Climate Emergency Institute -- 2021.jpg 800 × 450; 55 KB
- Climate emergency.jpg 800 × 450; 69 KB
- Climate Headline News around the World - July 2023.jpg 600 × 704; 151 KB
- Climate Legacy of Biden.jpg 600 × 687; 265 KB
- Climate Models.png 639 × 558; 123 KB
- Climate News - Oct 28 2022.jpg 626 × 600; 88 KB
- Climate News - United Nations Report - Feb 2022.png 768 × 878; 539 KB
- Climate News Dec 4 2023 in Dubai.png 800 × 1,037; 649 KB
- Climate Plans Enforcement - Resources - GreenPolicy.png 768 × 897; 686 KB
- Climate poll - Florida.png 640 × 267; 36 KB
- Climate strike - Week 171.png 739 × 600; 834 KB
- Climate Strike Around the World - Sep20,2019.jpg 700 × 830; 119 KB
- Climate Summit - Leonardo DiCaprio.png 600 × 663; 521 KB
- Climate Summit live updates - Nov 2 2021.png 751 × 600; 420 KB
- Climate Summit planned-1.jpg 800 × 301; 53 KB
- Climate Summit planned-2.jpg 800 × 187; 31 KB
- Climate Summit planned-3.jpg 800 × 278; 44 KB
- Climate Summit planned-4.jpg 800 × 241; 41 KB
- ClimateNewsFlorida.jpg 448 × 191; 36 KB
- CO2 at Mauna Loa data - June 02, 2020 - 417.90 ppm.jpg 640 × 566; 66 KB
- CO2 cumulative emissions 1850 - 2021 - countries.jpg 640 × 462; 211 KB
- CO2 emissions-around-the-world.png 800 × 595; 123 KB
- CO2 global pathways via IPCC AR6 - how will we respond.jpg 800 × 450; 57 KB
- Common Ground, the Movie.png 600 × 756; 775 KB
- Connect with Nature.png 405 × 280; 17 KB
- COP26 Climate Summit concludes.jpg 600 × 800; 160 KB
- COP26 concludes - 2.png 648 × 467; 177 KB
- COP26 concludes - 3.png 648 × 713; 416 KB
- COP26 concludes.png 648 × 528; 329 KB
- COP26 in GLASGOW - 31 OCT-12 NOV 2021.jpg 800 × 264; 51 KB
- COP27 'opening speech'.png 640 × 460; 160 KB
- COP28 News - Dec 13 2023.png 800 × 898; 410 KB
- CopernicusEU - Sentinel5P Atmosphere Monitoring Mission - 2.jpg 795 × 1,477; 654 KB
- CopernicusEU - Sentinel5P Atmosphere Monitoring Mission.png 583 × 465; 222 KB
- Coral bleaching - August 2023.png 488 × 430; 261 KB
- Coral bleaching - NOAA - August 2023.png 488 × 338; 201 KB
- Covering Climate Now.jpg 493 × 498; 67 KB
- Cradle of Civilization - and climate change.jpg 640 × 360; 70 KB
- Dated record of Earths climate - Science Report Sept 10 2020.jpg 735 × 669; 192 KB
- Death Valley ... the heat, what its like.jpg 640 × 381; 62 KB
- Defend Our Future 6-1-2020.jpg 585 × 458; 103 KB
- Democratic Climate Plan-Introduced June 2020.jpg 528 × 561; 117 KB
- Democratic National Convention-62 climate speakers.jpg 443 × 407; 57 KB
- Democratic Party pres candidates debate in Miami-June 2019.jpg 800 × 534; 124 KB
- DSCOVR EPIC - July 20 2022.png 532 × 612; 315 KB
- Earth AI - Feb 2022.png 482 × 480; 192 KB
- Earth Breathing.jpg 800 × 450; 117 KB
- Earth Day 2021 - Climate Summit News-1.jpg 491 × 270; 127 KB
- Earth Day 50 years on.jpg 480 × 548; 107 KB
- Earth in Human Hands Intro.png 622 × 423; 121 KB
- Earth Information Center - 2022 Graphic NASA.png 800 × 981; 868 KB
- Earth Information Center from NASA.jpg 800 × 577; 94 KB
- Earth Observing System - fleet of satellites.png 740 × 576; 557 KB
- Earth POV from the ISS Cupola-m.jpg 800 × 480; 71 KB
- Earth Summit 1992-s.png 336 × 418; 283 KB
- Earth Summit 1992.jpg 600 × 746; 171 KB
- Earth System Observatory-1.jpg 580 × 833; 129 KB
- Earth System Observatory-2.jpg 580 × 831; 69 KB
- Earth trapping unprecedented amount of heat - NASA.jpg 468 × 373; 56 KB
- Earth-upper-atmosphere-NASA.jpg 800 × 781; 327 KB
- EarthScience Missions via the EOS - 2022.png 800 × 219; 139 KB
- Economist.com global capital snapshot as of July 2020.jpg 800 × 477; 119 KB
- Ecostress Mission-Aug 2020.jpg 640 × 311; 85 KB
- Elephant herd from the End of the Game-by Peter Beard.jpg 800 × 544; 198 KB
- Elon Musk quote - gas externality price.png 680 × 320; 199 KB
- Energy Charter Treaty.jpg 512 × 480; 74 KB
- Energy Imbalance, Climate Change - Aug 1 2021.png 640 × 672; 394 KB
- Environmental laws in US - Supreme Court votes soon.png 800 × 414; 334 KB
- EO and Fire Ants in the US - on World Wildlife Day.png 768 × 811; 663 KB
- ESA Living Planet Symposium - Announcement.png 637 × 600; 508 KB
- ESA Living Planet Symposium - May 2022.png 700 × 600; 258 KB
- ESG Fight - Feb 2023.png 396 × 194; 88 KB
- ESRI logo.jpg 366 × 138; 10 KB
- Estuary in Clearwater on Tampa Bay.jpg 3,584 × 2,016; 1.5 MB
- EU agrees to cut emissions 55 percent by 2030.jpg 800 × 558; 96 KB
- EU unveils new climate change policy - July 14 2021 - 1.jpg 800 × 234; 33 KB
- EU unveils new climate change policy - July 14 2021 - 2.jpg 800 × 552; 86 KB
- EU unveils new climate change policy - July 14 2021 - 3.jpg 800 × 549; 89 KB
- EU unveils new climate change policy - July 14 2021 - 4.jpg 800 × 550; 92 KB
- EU unveils new climate change policy - July 14 2021 - 5.jpg 800 × 548; 88 KB
- EU unveils new climate change policy - July 14 2021 - 6.jpg 800 × 557; 89 KB
- EU unveils new climate change policy - July 14 2021 - 7.jpg 800 × 553; 92 KB
- EU unveils new climate change policy - July 14 2021 - 8.jpg 800 × 589; 91 KB
- Eukaryotic Cell SCU.jpg 716 × 1,024; 799 KB
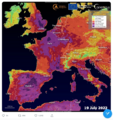
- Europe heat wave - July 19 2022 - via Copernicus satellite.png 600 × 639; 704 KB
- Extreme temperature-world-May 2024.jpg 640 × 427; 105 KB
- ExxonMobil CO2 climatic response study - Graphic 1 - 1982.png 537 × 680; 150 KB
- ExxonMobil CO2 climatic response study - Graphic 2 - 1982.png 537 × 605; 112 KB
- Facts about US Energy Use.jpg 697 × 600; 101 KB
- Farm du Bec Hellouin.jpg 800 × 480; 139 KB
- FarmersMarkets logos.png 1,533 × 537; 1.24 MB
- Fire Ants.png 601 × 600; 603 KB
- FOOD politics-health.jpg 462 × 145; 43 KB
- Food-Forests-Living-poster by Molly Danielsson.jpg 800 × 545; 113 KB
- Forest Moss and unseen 'tiny little ones'.PNG 800 × 1,104; 1.53 MB
- Fox on Earth Day 2023.jpg 640 × 275; 58 KB
- From 1968 to 1992 -- and the Journey continues....png 572 × 851; 320 KB
- Geosciences satellite fields b.jpg 461 × 444; 186 KB
- GHG forcings 1750-2020.png 531 × 531; 94 KB
- GHG ppt concentrations 1975-2020.jpg 640 × 361; 69 KB
- Gistemp 1979-2019.png 750 × 491; 335 KB
- Glasgow-Climate Conference News-Nov 6, 2021.png 600 × 800; 290 KB
- Glass Gem Corn.jpg 400 × 400; 21 KB
- Global Biodiversity Information-Data.png 501 × 266; 124 KB
- Global Changes in temperature 1850-2020.jpg 480 × 480; 152 KB
- Global Climate Change textbook-Edition2.jpg 604 × 680; 96 KB
- Global climate conferences and GHG increases.jpg 793 × 801; 56 KB
- Global Climate Dashboard - NOAA - Climate.gov.png 630 × 480; 165 KB
- Global climate dashboard-NOAA climate.gov.jpg 521 × 221; 45 KB
- Global climate dashboard-www.climate.gov.jpg 800 × 489; 100 KB
- Global Climate Dashboard.jpg 800 × 529; 101 KB
- Global Climate Strike - RU.jpg 450 × 804; 116 KB
- Global fossil fuel emissions - in a lifetime graphic.png 600 × 657; 233 KB
- Global greenhouse gas emissions - 1980 - 2020.png 640 × 480; 158 KB
- Global Primary Energy Consumption - 1800-2017.jpg 800 × 583; 65 KB
- Global Stocktake, the first GST.jpg 800 × 905; 513 KB
- Global temperature change 1850-2016.gif 512 × 288; 1.38 MB
- Global temperature change 1901-2000.jpg 640 × 508; 47 KB
- Global temperature variations over past 200 years.jpg 640 × 360; 29 KB
- Global warming June 2024.jpg 640 × 174; 46 KB

