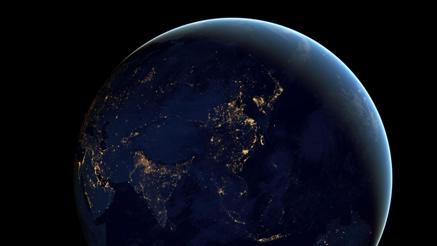
Virtual Earth
Earth Sciences / EcoExploring / Land Unit Mapping
Why Mapping, why GIS?
The many fields of earth and environmental science are open to new ways of seeing, discovering and applying solutions using the latest digital, information technology.
Across the globe and in each local community, new IT capabilities are employing terrestrial data collections techniques and 'eyes in the sky' to deliver data into mapping platform and applications. We are using software platforms and tools to analyze our world and planet's systems in ways never before available.
Across most every industry, our new digital skills touch how we live and how we sustain our environment and improve the quality of our lives.
Consider:
- Agriculture
- Climate, Weather, and the Atmosphere
- Conservation and Resources
- Environmental Management
- Forestry
- Mining and Safety
- Oceans and Fisheries
- Sustainable Development
- Water Resources
The opportunities to change what has been 'business-as-usual' to 'business-with-vision' are multiplying. Traditional economics is becoming an eco-nomics in the process of our new knowledge base and new ways of monitoring and observing change over time.
Take a look at just one 'case study' of how you can 'change the world' by using these new earth mapping tools.
Let's us introduce a friend of ours, a Bioneer, Rebecca Moore.
GreenPolicy360 highlights Rebecca Moore
Rebecca envisioned setting up Google Outreach -- and she did.
Then Rebecca convinced Google to 'grow' her venture -- and they did.
Here are two history-making ventures that change economic/eco-nomics and enable us, as http://www.planetcitizen.org planet citizens, to improve our world and work toward sustainable life systems and industries.
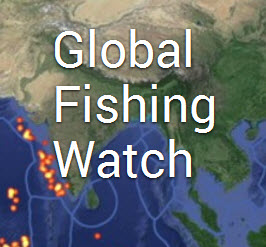
Global Fishing Watch
Google Earth Outreach Out in Front
Global Fishing Watch_launches [1]
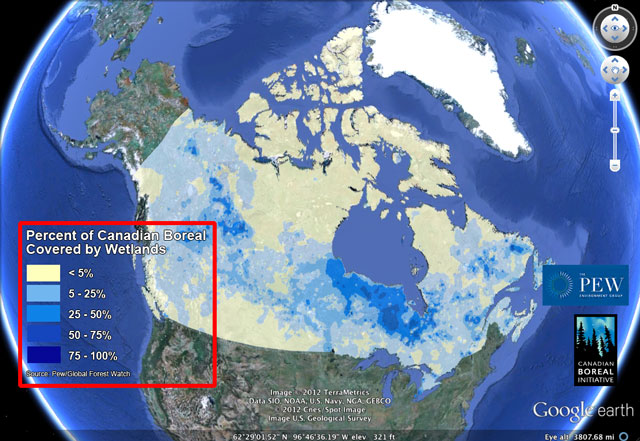
Global Forest Watch launches - 2014
Google Outreach continues its impact
Monitoring the world's forests
Start with where you are... just as Rebecca did, in her home community...
○ ○ ○ ○ ○ ○ ○ ○
Where Am I?
AI Facebook Mapping, Citizen Mapping, United Nations Mapping
- Facebook’s artificial-intelligence software... capable of mapping more in a week than humanity has mapped in history
○
○
○ ○ ○ ○ ○ ○ ○ ○ ○ ○ ○ ○ ○ ○ ○ ○ ○ ○ ○ ○ ○ ○ ○ ○ ○ ○ ○
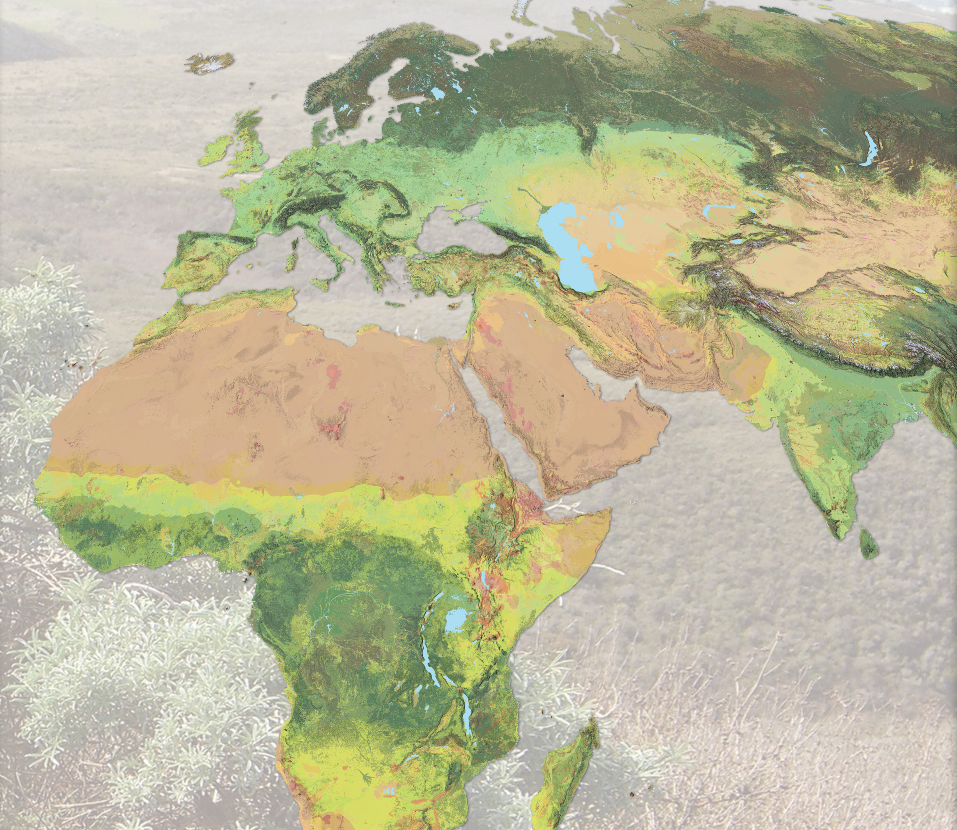
- New Maps of Global Ecological Land Units
http://ecoexplorer.arcgis.com/eco/maps.html
http://www.aag.org/global_ecosystems
http://www.aag.org/galleries/default-file/AAG_Global_Ecosyst_bklt300.pdf
http://www.wired.com/2015/02/new-map-shows-worlds-ecosystems-unprecedented-detail/
The Global Ecological Land Unit maps are the most detailed look ever at Earth’s ecosystems. Basically, it partitions the planet into squares 50 meters on a side—roughly the size of a couple of football fields. An ecosystem looks at lithology (that’s rocks and dirt), climate, topography, and land cover—from pristine forest to pavement. Each square on the map combines those categories of data, and every pixel can be described in a single sentence—say, warm, wet hills on volcanic rocks with mostly evergreen forests. Underneath: reams of reference. A world’s worth of data.
The US Geological Survey pulled that information from a wide swath of sources—soil surveys, digital elevation models, satellites, weather stations. But the agency didn’t have the computing power to chew it into meaningful maps. So, they partnered with ESRI, the titanic digital mapping company, which marshaled an army of geographers, analysts, and cartographers to knit everything together. Ecologists have always relied on maps made by experts based on their on-the-ground research. They were good, but subjective. Data is better. “It’s a huge confidence boost to the scientists that we are on the right track to understanding things in a comparable way,” says Charlie Frye, ESRI’s chief cartographer. After sharing it with veteran ecologists, Frye says they responded by telling him that this map showed them what they already knew, but at scales they’d never seen before.
And what’s good for research is good for conservation...
○ ○ ○ ○ ○ ○ ○ ○ ○ ○ ○ ○ ○ ○ ○ ○ ○ ○ ○ ○ ○ ○ ○
River Basins & Watersheds
Ecoregions
http://www.greenpolicy360.net/w/Category:Ecoregions
http://assets.panda.org/img/original/ecoregions_map.jpg
○ ○ ○ ○ ○ ○ ○ ○ ○ ○ ○ ○ ○ ○ ○ ○ ○ ○ ○ ○
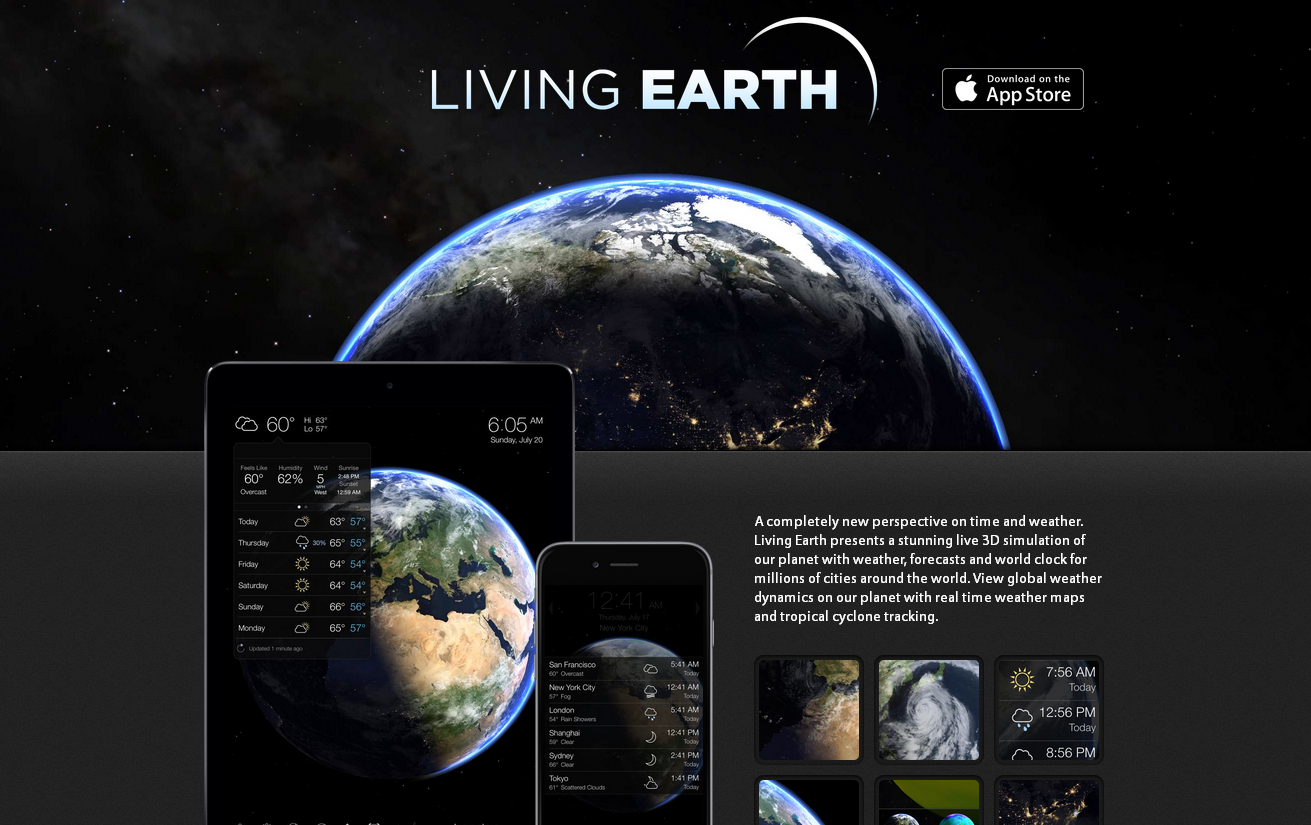
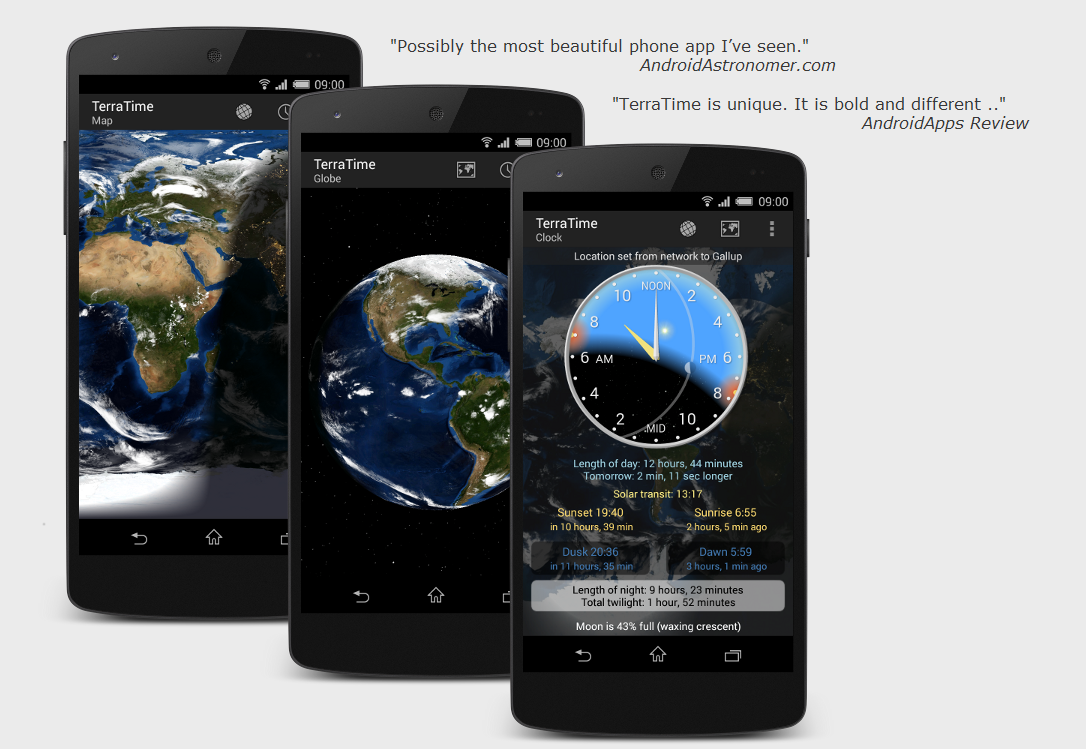
- APPS
Smartphone Apps/Browser add-ons/extensions
○ ○ ○ ○ ○ ○ ○ ○ ○ ○
- Google Maps
Introducing Voyager & Earth View
○ ○ ○ ○ ○ ○ ○ ○ ○ ○ ○ ○ ○ ○ ○ ○ ○ ○ ○ ○
Google Earth Pro is now available to download free/February 2015 - http://google-latlong.blogspot.com/2015/01/google-earth-pro-is-now-free.html
Google Earth http://www.google.com/earth/
- Google Earth Outreach
http://www.google.com/earth/outreach/tutorials/mapper_temp.html
http://www.google.com/earth/outreach/tutorials/spreadsheet.html
http://www.google.com/earth/outreach/tutorials/spreadsheet3.html
http://www.google.com/earth/outreach/tutorials/mapseng_lite.html
§
- Microsoft Bing / Virtual Earth
Bing Maps Platform (previously Microsoft Virtual Earth) http://www.microsoft.com/maps/
§
- NASA Maps
Web-enabled LandSat Data http://weld.cr.usgs.gov/
NASA World Wind http://worldwind.arc.nasa.gov/java/ -- http://worldwind.arc.nasa.gov/java/
"World Wind lets you zoom from satellite altitude into any place on Earth. Leveraging Landsat satellite imagery and Radar Topography data, World Wind lets you experience Earth terrain in visually rich 3D..."
NASA Earth Observatory Global Maps http://earthobservatory.nasa.gov/GlobalMaps/?eocn=topnav&eoci=globalmaps
○ ○ ○ ○ ○ ○ ○ ○ ○ ○ ○ ○ ○ ○
More Maps Online
- [https://www.greenpolicy360.net/w/File:ArcGIS-logo.png ArcGIS: Mapping & Analytics Platform}
- Bing Maps 3D interface runs inside Internet Explorer and Firefox, and uses NASA Blue Marble: Next Generation.
- Bhuvan is an India-specific virtual globe.
- Cesium, a WebGL virtual globe and map engine. Cesium is free and open-source software (Apache 2.0).
- CitySurf Globe, fast adaptation and transfer secured data due to special data storage structure, dynamic spatial data editing on 3D client monitor, data stored in Oracle SDO or PostGIS, flexible authorization models for different user groups (LDAP and Active Directory support) also excellent quality and fast 2D map rendering.
- driveme.in is a street view application for India.
- Earth3D, a program that visualizes the Earth in a real-time 3D view. It uses data from NASA, USGS, the CIA and the city of Osnabrück. Earth3D is free software (GPL).
- EarthBrowser, an Adobe Flash/AIR-based virtual globe with real-time weather forecasts, earthquakes, volcanoes, and webcams.
- Google Earth, satellite & aerial photos dataset (including commercial DigitalGlobe images) with international road dataset, the first popular virtual globe along with NASA World Wind.
- MapJack is a map feature covering areas in Canada, France, Latvia, Macau, Malaysia, Puerto Rico, Singapore, Sweden, Thailand, and the United States.
- Marble, part of the KDE, with data provided by OpenStreetMap, as well as NASA Blue Marble: Next Generation and others. Marble is Free and open-source software (LGPL).
- NASA World Wind, USGS topographic maps and several satellite and aerial image datasets, the first popular virtual globe along with Google Earth. World Wind is open-source software (NOSA).
- NORC is a street view web service for Central and Eastern Europe.
- OpenWebGlobe, a virtual globe SDK written in JavaScript using WebGL. OpenWebGlobe is free and open-source software (MIT).
- osgEarth is an open-source (LGPL) C++ SDK for global terrain rendering. It can pull data from web services(WMS, WCS, TMS) as well as many GDAL supported formats.
- PYXIS WorldView, integrates multisource local and remote GIS content on a discrete global Grid (spatial index) system for analysis and sharing.
- Science On A Sphere (SOS) Explorer, free virtual globe from National Oceanic and Atmospheric Administration (NOAA) enables users to explore the world and environmental data.
- Worldwide Telescope features an Earth mode with emphasis on data import/export, time-series support and a powerful Tour authoring environment.
Consider (from Wikipedia) how data can be collected for mapping, for GIS, for applications and platforms:
Example of hardware for mapping (GPS and laser rangefinder) and data collection (rugged computer). The current trend for geographical information system (GIS) is that accurate mapping and data analysis are completed while in the field. Depicted hardware (field-map technology) is used mainly for forest inventories, monitoring and mapping. Data capture—entering information into the system—consumes much of the time of GIS practitioners. There are a variety of methods used to enter data into a GIS where it is stored in a digital format.
Existing data printed on paper or PET film maps can be digitized or scanned to produce digital data. A digitizer produces vector data as an operator traces points, lines, and polygon boundaries from a map. Scanning a map results in raster data that could be further processed to produce vector data.
Survey data can be directly entered into a GIS from digital data collection systems on survey instruments using a technique called coordinate geometry (COGO). Positions from a global navigation satellite system (GNSS) like Global Positioning System can also be collected and then imported into a GIS. A current trend in data collection gives users the ability to utilize field computers with the ability to edit live data using wireless connections or disconnected editing sessions. This has been enhanced by the availability of low-cost mapping-grade GPS units with decimeter accuracy in real time. This eliminates the need to post process, import, and update the data in the office after fieldwork has been collected. This includes the ability to incorporate positions collected using a laser rangefinder. New technologies also allow users to create maps as well as analysis directly in the field, making projects more efficient and mapping more accurate.
Remotely sensed data also plays an important role in data collection and consist of sensors attached to a platform. Sensors include cameras, digital scanners and lidar, while platforms usually consist of aircraft and satellites. In England in the mid 1990s, hybrid kite/balloons called Helikites first pioneered the use of compact airborne digital cameras as airborne Geo-Information Systems. Aircraft measurement software, accurate to 0.4 mm was used to link the photographs and measure the ground. Helikites are inexpensive and gather more accurate data than aircraft. Helikites can be used over roads, railways and towns where UAVs are banned.
Recently with the development of miniature UAVs, aerial data collection is becoming possible with them. For example, the Aeryon Scout was used to map a 50-acre area with a Ground sample distance of 1 inch (2.54 cm) in only 12 minutes.
The majority of digital data currently comes from photo interpretation of aerial photographs. Soft-copy workstations are used to digitize features directly from stereo pairs of digital photographs. These systems allow data to be captured in two and three dimensions, with elevations measured directly from a stereo pair using principles of photogrammetry. Analog aerial photos must be scanned before being entered into a soft-copy system, for high-quality digital cameras this step is skipped.
Satellite remote sensing provides another important source of spatial data. Here satellites use different sensor packages to passively measure the reflectance from parts of the electromagnetic spectrum or radio waves that were sent out from an active sensor such as radar. Remote sensing collects raster data that can be further processed using different bands to identify objects and classes of interest, such as land cover.
When data is captured, the user should consider if the data should be captured with either a relative accuracy or absolute accuracy, since this could not only influence how information will be interpreted but also the cost of data capture.
After entering data into a GIS, the data usually requires editing, to remove errors, or further processing. For vector data it must be made "topologically correct" before it can be used for some advanced analysis. For example, in a road network, lines must connect with nodes at an intersection. Errors such as undershoots and overshoots must also be removed. For scanned maps, blemishes on the source map may need to be removed from the resulting raster. For example, a fleck of dirt might connect two lines that should not be connected.
○
More References
○
○
○
○
Carto
○ ○ ○ ○ ○ ○ ○ ○ ○ ○ ○ ○ ○
- Earth Biosphere Mapping
○ ○ ○ ○ ○ ○ ○ ○ ○ ○ ○ ○ ○ ○ ○ ○ ○ ○ ○ ○ ○ ○ ○
Index Mundi -- http://www.indexmundi.com/factbook/countries
○
United Nations / National sites -- Environmental Data -- http://unstats.un.org/unsd/environment/clinks.htm
○
World Bank/Country Data -- http://data.worldbank.org/country
○
Environmental Performance Index (EPI) -- http://epi.yale.edu/reports/2016-report
○
Environmental Law -- http://www.globalenvironmentallaw.org/Site/COUNTRY_PROFILES.html
○
OECD (see Environmental Data) -- http://stats.oecd.org/index.aspx
○
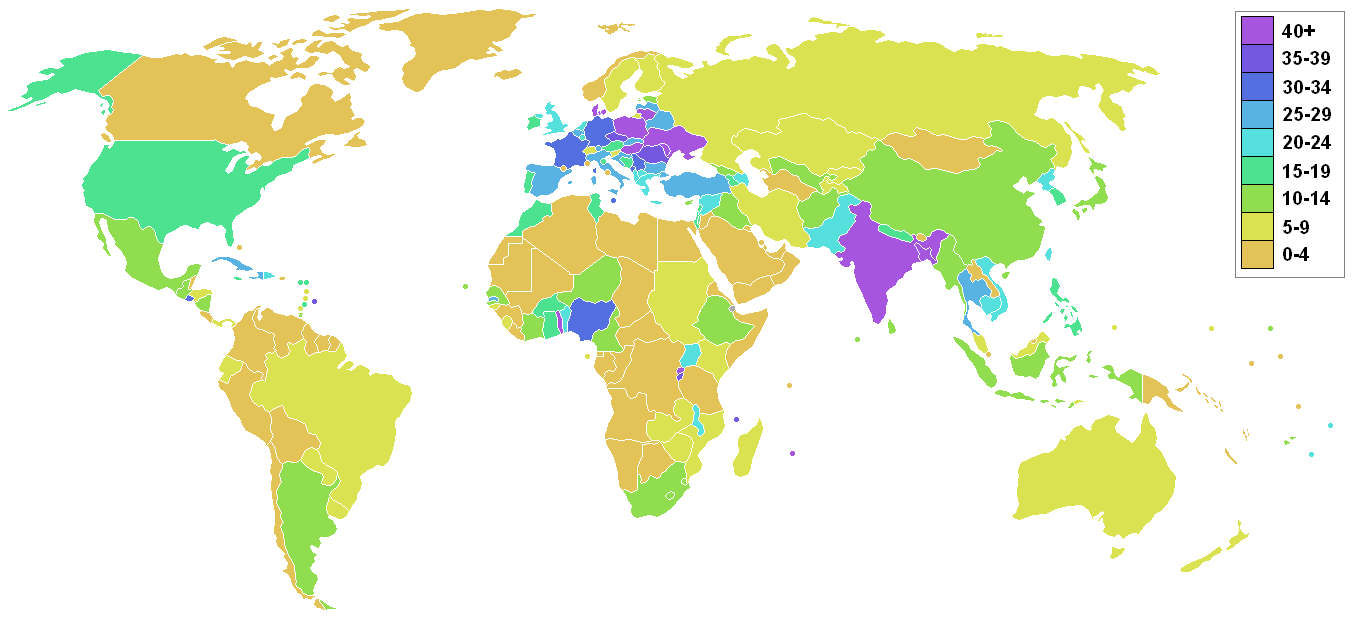
Arable Land Percent - World
https://en.wikipedia.org/wiki/Arable_land
○
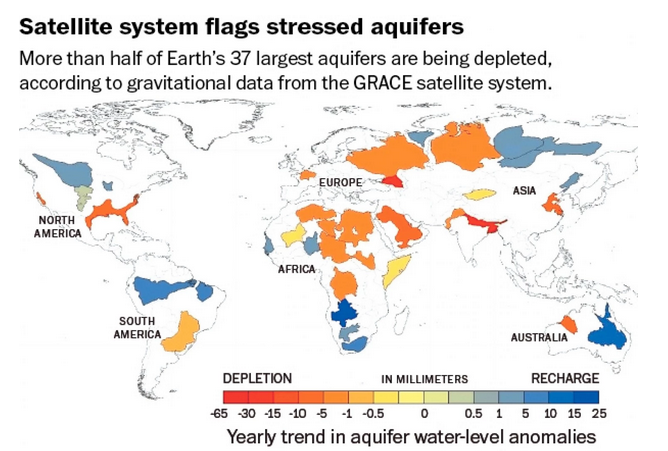
http://mashable.com/2015/06/16/groundwater-aquifers-depleted/
http://touch.latimes.com/#section/-1/article/p2p-83799955/
http://www.nzherald.co.nz/world/news/article.cfm?c_id=2&objectid=11466534
○
- Country
- Maps
- Aquifers
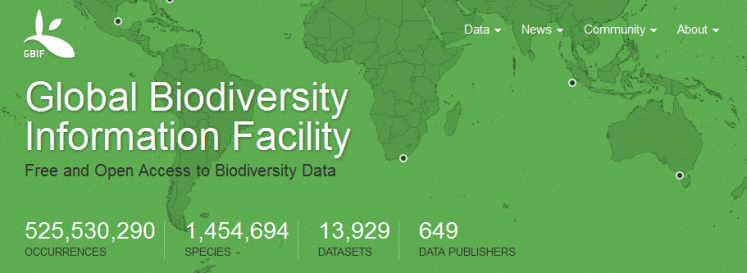
- Biodiversity
- Citizen Science
- Climate Change
- Desertification
- Digital Citizen
- Earth360
- EarthPOV
- Earth Imaging
- Earth Observations
- Earth Law
- Earth Science
- Earth Science from Space
- Ecology Studies
- Environmental Full-cost Accounting
- Environmental Protection
- Environmental Security
- Environmental Security, National Security
- EOS eco Operating System
- Externalities
- Forest
- Forests
- Land Ethic
- New Space
- Oceans
- Permaculture
- Planet API
- Planet Citizen
- Planet Scientist
- Planet Citizens, Planet Scientists
- Planetary Science
- Sustainability
- Sustainability Policies
- ThinBlueLayer
- Virtual Earth
- Virtual Planet
- Water
- Whole Earth
- Atmospheric Science
- Biogeosciences
- Cryosphere
- Geology
- Geophysics
- Geophysics and Geochemistry
- Hydrology
- Mineralogy
- Natural Resources
- Ocean Science
- Space Science and Space Physics

