File:Oceans heat added 1955-2011 lawrencelivermorelab 2016.jpg
Oceans_heat_added_1955-2011_lawrencelivermorelab_2016.jpg (477 × 480 pixels, file size: 30 KB, MIME type: image/jpeg)
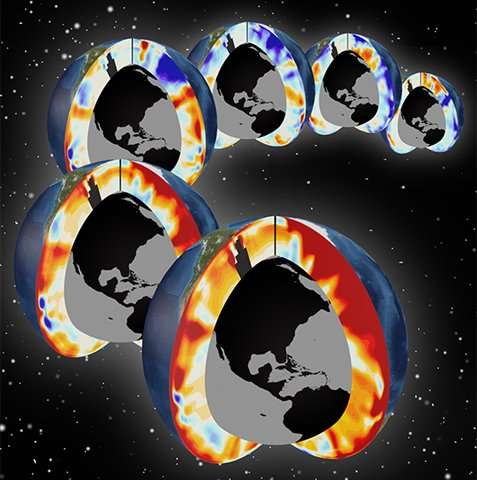
This image provided by Lawrence Livermore National Laboratory shows Pacific and Atlantic meridional sections showing upper-ocean warming for the past six decades (1955-2011). Red colors indicate a warming (positive) anomaly and blue colors indicate a cooling (negative) anomaly. The amount of global-warming triggered heat energy absorbed by the seas has doubled since 1997, a new study showed. Scientists have long known that more than 90 percent of the heat energy from man-made global warming goes into the world’s oceans instead of the ground. And they’ve seen ocean heat content rise in recent years. But a new study using ocean observing data that goes back to the British research ship Challenger in the 1870s, includes high-tech modern underwater monitors and computer models, tracked how much man-made heat has been buried in the oceans in the past 150 years.
Man-made heat put in oceans has doubled since 1997, study finds
○
Predictions: Climate change to speed up
- Climate scientists say human impacts are adding up faster than reported...
File history
Click on a date/time to view the file as it appeared at that time.
| Date/Time | Thumbnail | Dimensions | User | Comment | |
|---|---|---|---|---|---|
| current | 22:02, 18 January 2016 | | 477 × 480 (30 KB) | Siterunner (talk | contribs) | [http://phys.org/news/2016-01-man-made-oceans.html '''''Man-made heat put in oceans has doubled since 1997, study finds'''''] : [https://www.washingtonpost.com/news/energy-environment/wp/2016/01/18/this-is-where-90-percent-of-global-warming-is-going/ '... |
You cannot overwrite this file.
File usage
The following 2 pages use this file: