File:China air 2005 2014.jpg: Difference between revisions
Siterunner (talk | contribs) No edit summary |
Siterunner (talk | contribs) No edit summary |
||
| (One intermediate revision by the same user not shown) | |||
| Line 1: | Line 1: | ||
'''China air quality -- measuring, monitoring from space''' | |||
2005 to 2014 | |||
''Using new, high-resolution global satellite maps of air quality indicators, NASA scientists tracked air pollution trends over the last decade in various regions and 195 cities around the globe. The findings were presented Monday at the American Geophysical Union meeting in San Francisco and published in the Journal of Geophysical Research.'' | |||
''"With the new high-resolution data, we are now able to zoom down to study pollution changes within cities, including from some individual sources, like large power plants".'' | |||
''Previous work using satellites at lower resolution missed variations over short distances. This new space-based view offers consistent information on pollution for cities or countries that may have limited ground-based air monitoring stations. The resulting trend maps tell a unique story for each region...'' | |||
''China, the world's growing manufacturing hub, saw an increase of 20 to 50 percent in nitrogen dioxide, much of it occurring over the North China Plain. Three major Chinese metropolitan areas -- Beijing, Shanghai, and the Pearl River Delta -- saw nitrogen dioxide reductions of as much as 40 percent.'' | |||
• | |||
Latest revision as of 18:00, 19 April 2020
China air quality -- measuring, monitoring from space
2005 to 2014
Using new, high-resolution global satellite maps of air quality indicators, NASA scientists tracked air pollution trends over the last decade in various regions and 195 cities around the globe. The findings were presented Monday at the American Geophysical Union meeting in San Francisco and published in the Journal of Geophysical Research.
"With the new high-resolution data, we are now able to zoom down to study pollution changes within cities, including from some individual sources, like large power plants".
Previous work using satellites at lower resolution missed variations over short distances. This new space-based view offers consistent information on pollution for cities or countries that may have limited ground-based air monitoring stations. The resulting trend maps tell a unique story for each region...
China, the world's growing manufacturing hub, saw an increase of 20 to 50 percent in nitrogen dioxide, much of it occurring over the North China Plain. Three major Chinese metropolitan areas -- Beijing, Shanghai, and the Pearl River Delta -- saw nitrogen dioxide reductions of as much as 40 percent.
•
File history
Click on a date/time to view the file as it appeared at that time.
| Date/Time | Thumbnail | Dimensions | User | Comment | |
|---|---|---|---|---|---|
| current | 18:52, 11 April 2020 | 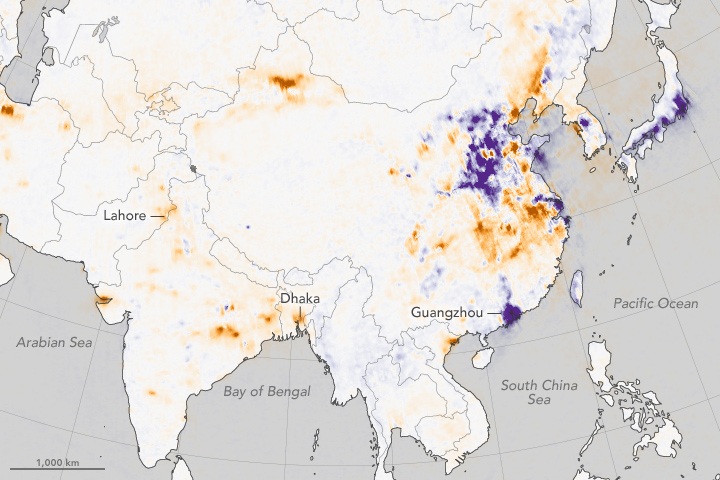 | 720 × 480 (160 KB) | Siterunner (talk | contribs) |
You cannot overwrite this file.
File usage
The following page uses this file: