File:Toward the Hothouse.png
Toward_the_Hothouse.png (800 × 337 pixels, file size: 160 KB, MIME type: image/png)
Past and Future Trends (Image)
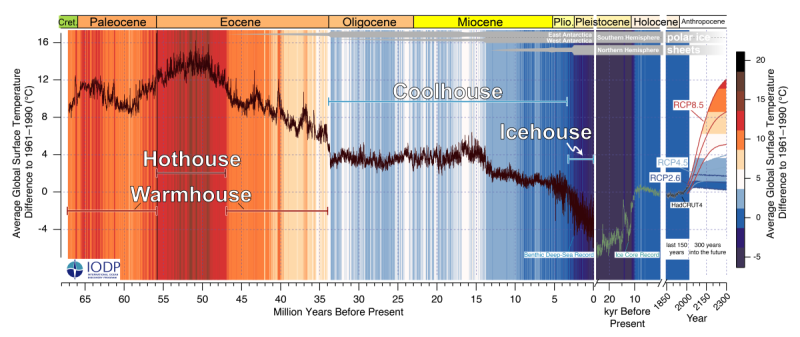
- Global mean temperature spanning the last 67 million years
Earth barreling toward 'Hothouse' state
For the first time, climate scientists have compiled a continuous, high-fidelity record of variations in Earth's climate extending 66 million years into the past. The record reveals four distinctive climate states, which the researchers dubbed Hothouse, Warmhouse, Coolhouse, and Icehouse.
These major climate states persisted for millions and sometimes tens of millions of years, and within each one the climate shows rhythmic variations corresponding to changes in Earth's orbit around the sun. But each climate state has a distinctive response to orbital variations, which drive relatively small changes in global temperatures compared with the dramatic shifts between different climate states.
The new findings, published September 10 in Science, are the result of decades of work and a large international collaboration. The challenge was to determine past climate variations on a time scale fine enough to see the variability attributable to orbital variations (in the eccentricity of Earth's orbit around the sun and the precession and tilt of its rotational axis).
"We've known for a long time that the glacial-interglacial cycles are paced by changes in Earth's orbit, which alter the amount of solar energy reaching Earth's surface, and astronomers have been computing these orbital variations back in time," explained coauthor James Zachos, distinguished professor of Earth and planetary sciences and Ida Benson Lynn Professor of Ocean Health at UC Santa Cruz.
"As we reconstructed past climates, we could see long-term coarse changes quite well. We also knew there should be finer-scale rhythmic variability due to orbital variations, but for a long time it was considered impossible to recover that signal," Zachos said. "Now that we have succeeded in capturing the natural climate variability, we can see that the projected anthropogenic warming will be much greater than that."
~
Into the hothouse
According to the researchers, the current pace of anthropogenic global warming far exceeds the natural climate fluctuations seen at any other point in the Cenozoic era, and has the potential to hyper-drive our planet out of a long icehouse phase into a searing hothouse state.
"Now that we have succeeded in capturing the natural climate variability, we can see that the projected anthropogenic warming will be much greater than that," study co-author James Zachos, professor of Earth and planetary sciences at the University of California, Santa Cruz, said in a statement. "The Intergovernmental Panel on Climate Change (IPCC) projections for 2300 in the 'business-as-usual' scenario will potentially bring global temperature to a level the planet has not seen in 50 million years." (The IPCC is a United Nations group that assesses the science, risks and impacts of climate change on the planet.)
~
To compile their new era-long climate map, the study authors examined fossil foram shells in deep-sea sediment cores — long tubes of rock, sediment and microbes — drilled from the world's oceans over the past several decades. Forams (short for foraminifera) are microscopic plankton whose oldest relatives appeared in the ocean close to a billion years ago; the deeper scientists dig into the seabed, the older the foram specimens they uncover.
The ratios of carbon and oxygen isotopes (versions of elements) in foram shells hold critical climate information. The ratio between the oxygen isotopes oxygen-18 and oxygen-16, for example, can reveal how warm the surrounding water was when a foram constructed its shell; the higher the ratio, the colder the water. The ratio between carbon-13 and carbon-12 shows how much organic carbon was available for the microbes to eat; here, a higher ratio correlates with more greenhouse gases (like carbon dioxide) in the atmosphere.
Because the team's climate record covers such an incredibly long time period, the researchers also had to consider astronomic impacts on the planet's climate — that is, how Earth's slowly changing orbit and tilt toward the sun impact the amount of sunlight reaching different parts of the planet at different times, also known as Milankovitch cycles. When the team overlaid orbital data with their isotopic climate data, they saw that orbital variations created distinct but relatively small-scale changes to the global climate. Crucially, each big jump between climate states was tied to a massive shift in greenhouse gas levels...
- ○

File history
Click on a date/time to view the file as it appeared at that time.
| Date/Time | Thumbnail | Dimensions | User | Comment | |
|---|---|---|---|---|---|
| current | 14:01, 11 September 2020 | | 800 × 337 (160 KB) | Siterunner (talk | contribs) |
You cannot overwrite this file.
File usage
The following 8 pages use this file:
- Climate Change
- Climate Policy
- About Us
- Air Quality
- Air Pollution
- Agriculture
- Alternative Agriculture
- Antarctica
- Anthropocene
- Arctic
- Atmospheric Science
- Citizen Science
- City Governments
- Climate Migration
- County Governments
- Desertification
- Digital Citizen
- Earth Imaging
- Earth Observations
- Earth360
- Earth Science
- Earth Science from Space
- Earth System Science
- Ecology Studies
- Eco-nomics
- Economic Justice
- Education
- Energy
- Environmental Laws
- Environmental Protection
- Environmental Security
- Environmental Security, National Security
- ESA
- European Union
- Externalities
- Extinction
- Florida
- Food
- Forests
- Fossil Fuels
- Greenland
- Global Security
- Global Warming
- Green Graphics
- Green Networking
- Green Best Practices
- Green Politics
- Health
- INDC
- Maps
- Money in Politics
- NASA
- NOAA
- Natural Resources
- Networking
- New Definitions of National Security
- New Economy
- New Space
- Oceans
- Ocean Science
- Online Education
- Planet Citizen
- Planet Citizens
- Planet Citizens, Planet Scientists
- Rainforest
- Renewable Energy
- Resilience
- Sea-level Rise
- Sea-Level Rise & Mitigation
- Social Justice
- Soil
- Solar Energy
- Strategic Demands
- Sustainability Policies
- Threat Multiplier
- United Nations
- US
- US Environmental Protection Agency
- Water Quality
- Whole Earth