File:ESA re ice loss - April 2023.png
ESA_re_ice_loss_-_April_2023.png (640 × 432 pixels, file size: 213 KB, MIME type: image/png)
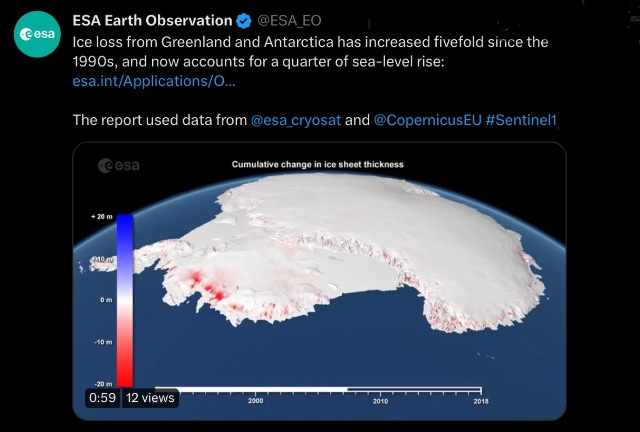
ESA Reports Ice Loss > Sea-Level Rise
- and there's Thwaites (in reddish graph colors in the Antarctic)
Ice loss from Greenland and Antarctica hits new record
Ice loss from Greenland and Antarctica has increased fivefold since the 1990s, and now accounts for a quarter of sea-level rise.
It is without doubt that climate change is causing our polar ice sheets to melt, thereby driving up sea levels and putting coastal regions around the world at risk.
Since 1992, when satellite records of ice-sheet melt began, the polar ice sheets have lost ice every single year. The highest rates of melt have occurred in the past decade.
Scientists use data from satellites such as ESA’s CryoSat and the European Union’s Copernicus Sentinel-1 to measure changes in ice volume and flow, as well as satellites that provide information on gravity, to work out how much ice is being lost.
A team of scientists compile these records in the Ice Sheet Mass Balance Intercomparison Exercise (IMBIE), which is funded by ESA and NASA. This is used widely, including by the International Panel on Climate Change (IPCC), to understand and respond to the climate crisis.
The latest IMBIE assessment, which was published today, states that between 1992 and 2020, the polar ice sheets lost 7560 billion tonnes of ice – equivalent to an ice cube measuring 20 km each side...
~
File history
Click on a date/time to view the file as it appeared at that time.
| Date/Time | Thumbnail | Dimensions | User | Comment | |
|---|---|---|---|---|---|
| current | 14:13, 20 April 2023 | | 640 × 432 (213 KB) | Siterunner (talk | contribs) |
You cannot overwrite this file.
File usage
The following page uses this file: