File:Annual CO2 emissions.png
Annual_CO2_emissions.png (800 × 582 pixels, file size: 103 KB, MIME type: image/png)
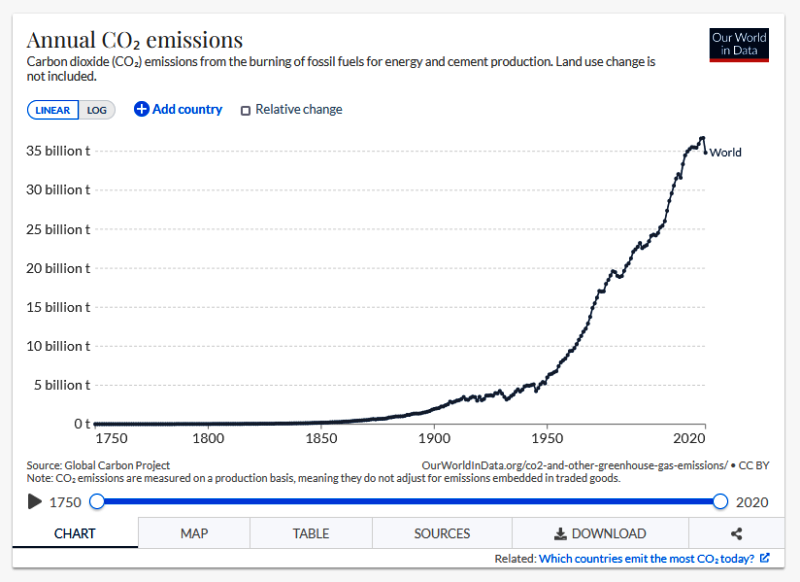
How have global emissions of carbon dioxide (CO2) changed over time?
In this chart we see the growth of global emissions from the mid-18th century through to today.
We see that prior to the Industrial Revolution, emissions were very low. Growth in emissions was still relatively slow until the mid-20th century. In 1950 the world emitted 6 billion tonnes of CO2
By 1990 this had almost quadrupled, reaching more than 22 billion tonnes
Emissions have continued to grow rapidly; we now emit over 34 billion tonnes each year
Emissions growth has slowed over the last few years, but they have yet to reach their peak
File history
Click on a date/time to view the file as it appeared at that time.
| Date/Time | Thumbnail | Dimensions | User | Comment | |
|---|---|---|---|---|---|
| current | 17:43, 28 December 2021 | | 800 × 582 (103 KB) | Siterunner (talk | contribs) |
You cannot overwrite this file.
File usage
The following 3 pages use this file: